

Health Reports
Subscription Health Report
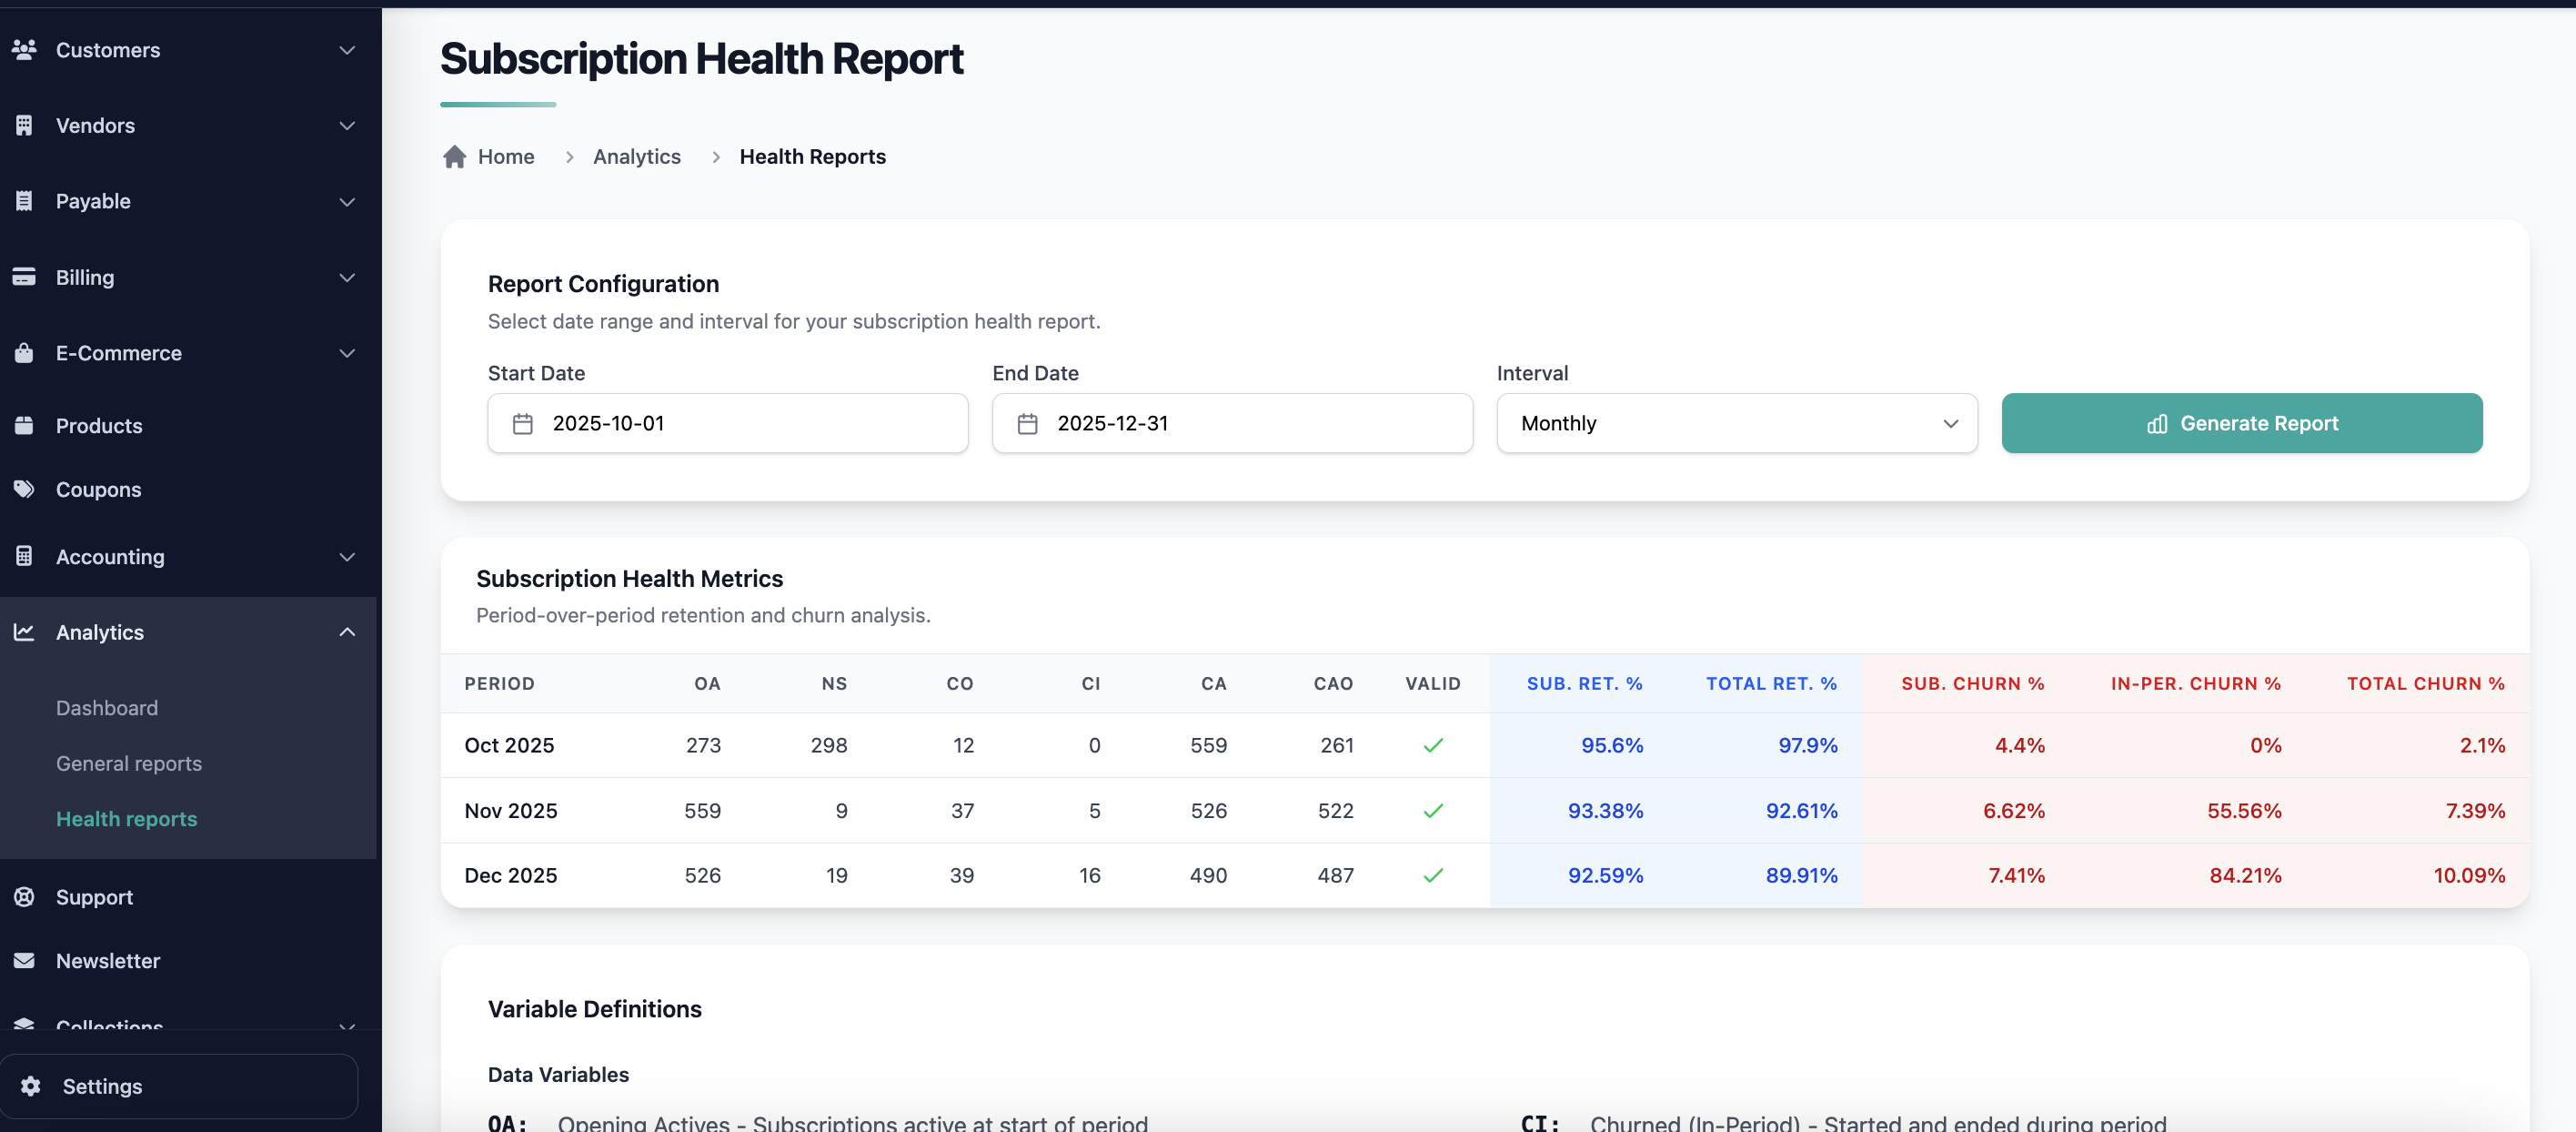
The Subscription Health Report provides clear visibility into subscription activity over time, allowing Pelcro clients to measure retention, churn, and cohort performance across any selected date range.
This report helps subscription, finance, and retention teams understand historical trends and forecast future subscriber behavior.
Overview
The Subscription Health Report allows you to:
- Analyze subscription performance across any selected date range and interval (e.g., monthly, weekly).
- Track how many subscriptions were active, newly started, or churned during each interval.
- Evaluate retention and churn behavior using industry-standard metrics.
- Export all data for further financial modeling or analytics.
Where to Find the Report
You can access the Subscription Health Report from:
Analytics → Health Reports → Subscription Health Report
This is where Pelcro centralizes all retention and churn–related analytics.
Date Range & Interval Logic
You can choose:
- A custom start and end date
- An interval (e.g., Monthly, Weekly)
For each interval within the selected range, Pelcro generates a row of subscription metrics.
Example
If you select Jan 1, 2024 → Dec 31, 2024 with a Monthly interval:
The report produces rows such as:
- Jan 1–31
- Feb 1–29
- Mar 1–31
…etc.
Report Variables
Each interval includes the following computed fields:
| Name | Variable | Description |
|---|---|---|
| Opening Actives | OA | Subscriptions active at the start of the period |
| New Starts | NS | Subscriptions created during the period |
| Churned (Opening Cohort) | CO | Subscriptions active at the start but ended during the period |
| Churned (In-Period) | CI | Subscriptions that began and ended within the period |
| Closing Actives | CA | Subscriptions active at the end of the period |
| Closing Actives (Opening Cohort) | CAO | Subscriptions active at start that remain active at period end |
Validation Rule
To ensure accuracy, the following formula must hold true:
CA = OA + NS − CO − CI
This acts as the self-balancing check for each interval.
Retention & Churn Metrics
Based on the interval data, the report calculates key metrics:
Retention Metrics
-
Subscription Retention Rate:
(OA − CO) / OA -
Total Retention Rate:
CA / (OA + NS)
Churn Metrics
-
Subscription Churn Rate:
CO / OA -
In-Period Churn Rate:
CI / NS -
Total Churn Rate:
(CO + CI) / (OA + NS)
These KPIs provide a comprehensive understanding of subscriber behavior and product stability.
How It Works
For each interval, Pelcro analyzes all subscription events (activations, renewals, cancellations) to compute:
- Active subscriptions at interval start
- New subscriptions created within the window
- Churn from existing subscribers
- Short-term churn (new subscriptions that cancel quickly)
- Closing Actives based on real subscription states
- Retention and churn metrics derived from the above
Use Cases
- Monitor subscriber health month over month
- Identify churn spikes or retention improvements
- Track subscription growth patterns
- Share insights with marketing, finance, and leadership teams
- Forecast expected future churn or renewal behavior
- Compare different segments, cohorts, or campaigns
Summary
The Subscription Health Report gives Pelcro clients a clear, accurate, and standardized way to measure subscription growth, retention, and churn across any timeframe. It serves as a foundational tool for data-driven subscription strategy and forecasting.
Updated 8 months ago