

Customers Activity
Centralized view into user behavior across your platform
About
Beta: The Customers Activity page is currently in beta. Functionality and tracked events may evolve as we expand coverage.
The Customers Activity page is your centralized view into user behavior across your platform. Instead of manually copying activity from individual customer dashboards, you can browse, filter, and export the complete activity log for all your customers from a single screen — built directly on top of our new analytics database.
This page is purpose-built for analytics teams, marketing teams, and business owners who need to analyze reader behavior, build reports, and derive insights without manual copy-pasting or relying on per-customer exports.
How it Works
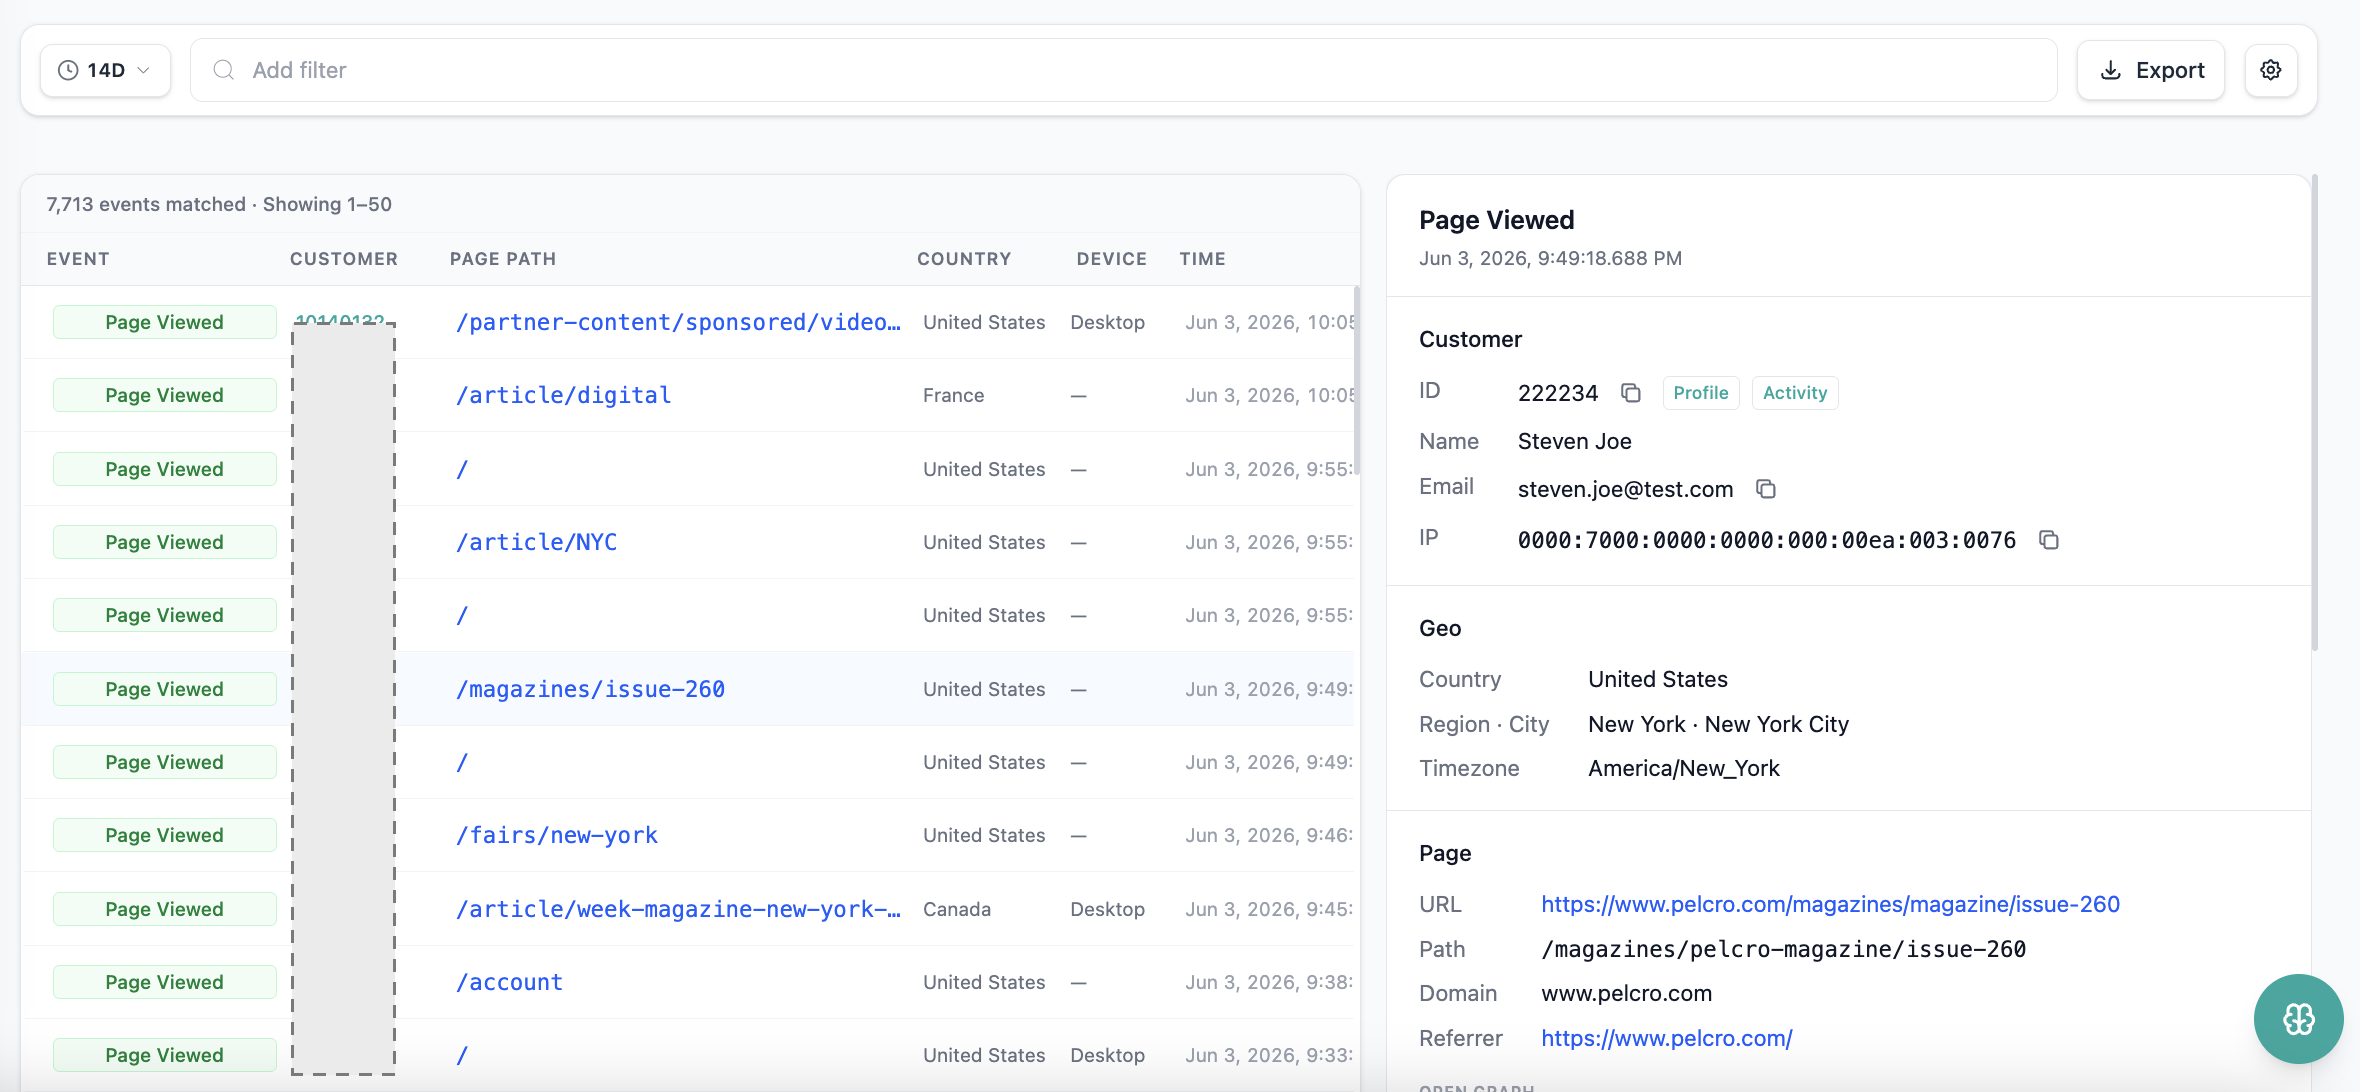
The Customers Activity page presents a real-time list view of every tracked event across your customers, enriched with customer, geo, device, and page context. Each row represents a single event; clicking it opens a detail panel with the full event payload.
Accessing Customers Activity
To access the Customers Activity page:
- Login to your Pelcro account
- From the left navigation menu, go to Analytics > Customers Activity
You'll see a paginated list of recent events with the total count surfaced at the top.
Overview Metrics & Acquisition Funnel
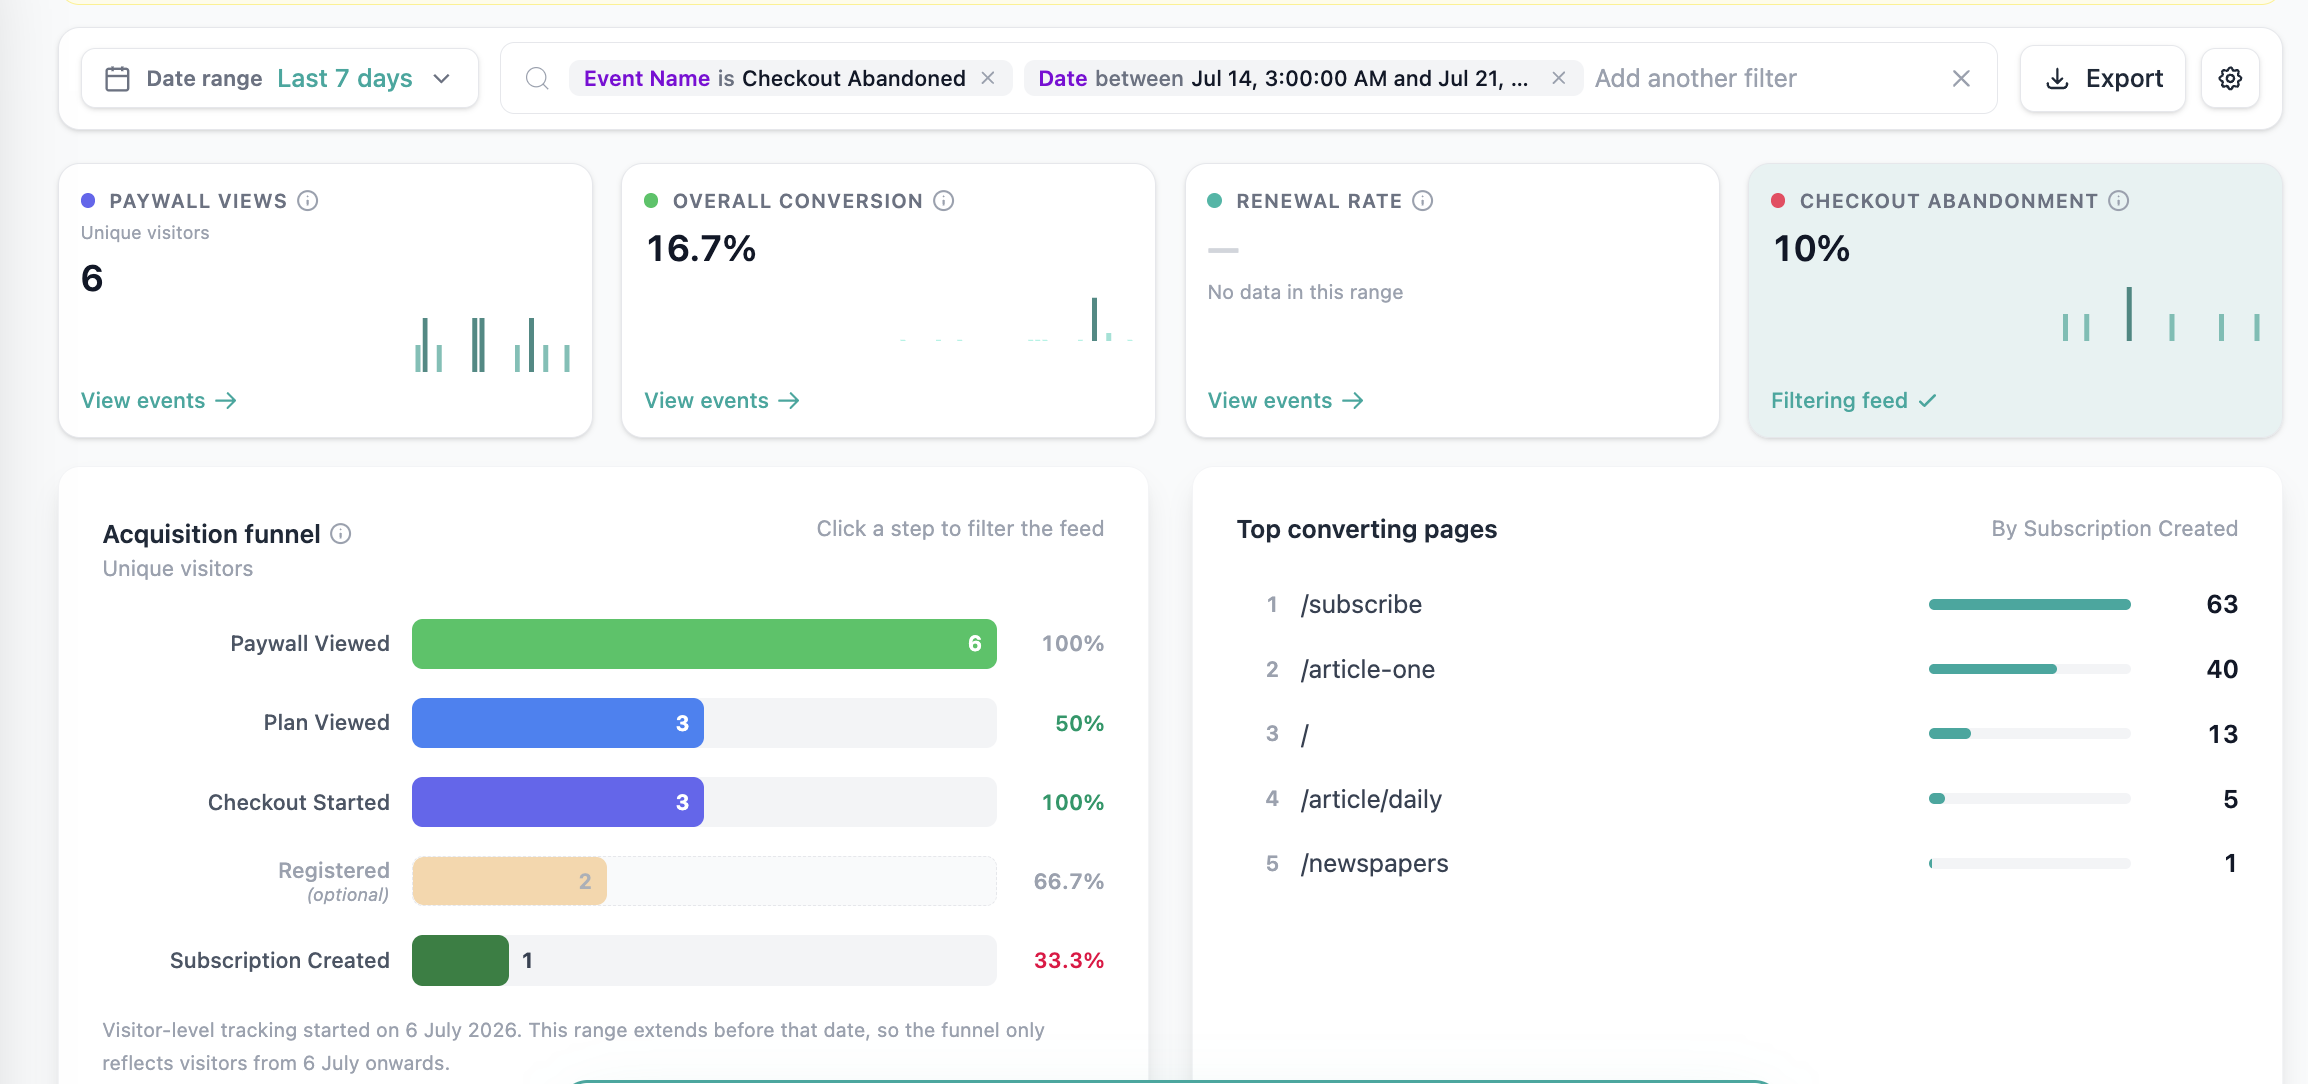
At the top of the Customers Activity page, an overview band summarizes conversion at a glance — so you can read performance directly on the page instead of exporting and joining data externally. Everything in this band is scoped to the active date range; when you change the page's date filter, all cards, the funnel, and the event list recalculate together.
Summary cards
Four cards give you the headline numbers for the selected period:
| Card | What it shows |
|---|---|
| Paywall Views | How many times your paywall was displayed |
| Overall Conversion | The share of paywall viewers who went on to subscribe |
| Checkout Abandonment | The share of started checkouts that were not completed |
| Renewal Rate | The rate at which subscriptions renewed over the period |
Acquisition Funnel
The Acquisition Funnel visualizes how visitors move toward a subscription, with a count and step-to-step conversion rate at each stage:
Paywall Displayed → Plan Viewed → Checkout Started → Registered → Subscription Created
This makes it easy to spot exactly where prospects drop off so you can focus your optimization efforts.
Top Converting Pages
A ranked list of the top 10 page paths by attributed subscriptions, so you can see which content is driving the most conversions.
Drill into any number
Every element in the overview is interactive. Click any card, funnel step, or page row to filter the activity list below to the matching events — letting you go straight from a headline number to the individual customers behind it. Exports respect any active filters.
Don't see any data here? If your cards and funnel are empty, your site is likely running an older UI version that doesn't yet emit these events. Contact [email protected] or your Account Manager to upgrade to the latest default UI and start populating these metrics.
Browsing the Activity List
The activity list displays the following columns for each event:
| Column | Description |
|---|---|
| Event | The event type (e.g., Page Viewed, Modal Displayed, Subscribed) |
| Customer ID | The unique ID of the customer who triggered the event — clickable to navigate to their profile |
| Path | The page path where the event occurred |
| Country | The country resolved from the customer's IP address |
| Device | The device type (Desktop, Mobile, Tablet) |
| Time | The precise timestamp of the event |
Click any row to open the event detail panel on the right.
Event Detail Panel
When you click an event row, the right-hand panel displays the full context of that event, organized into sections:
- Event header — event name and timestamp
- Customer — ID (with copy button), Name, Email, and IP address, plus quick links to the customer's Profile and Activity views
- Geo — Country, Region · City, and Timezone
- Page — URL, Path, Domain, and Referrer
- Metadata — additional event-specific fields
Filtering Events
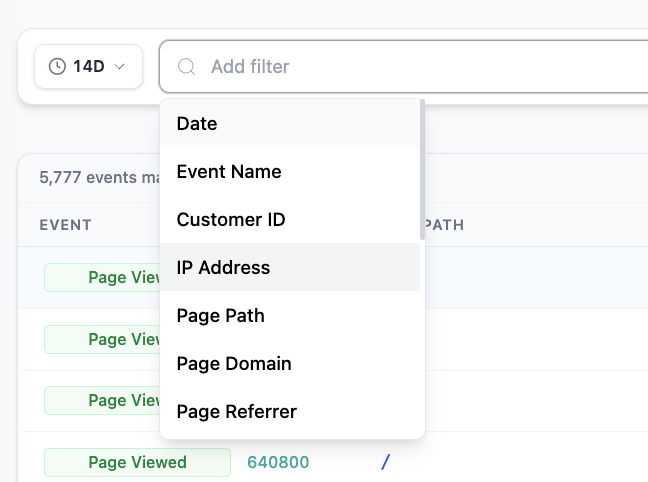
Use the Add filter search bar at the top of the page to narrow down events. Available filters include:
- Date — filter by a specific date or date range
- Event Name — filter by event type (e.g., Page Viewed, Modal Displayed)
- Customer ID — find all events for a specific customer
- IP Address — filter by the originating IP
- Page Path — events on a specific path
- Page Domain — events on a specific domain
- Page Referrer — events with a specific referrer
The 14D time-range selector at the top-left controls the default lookback window. You can adjust it as you wish with the needed time range.
Exporting Activity Data
Click the Export button at the top-right of the page to download a CSV of the current filtered view.
Complete logs, not just the visible pageExports include complete event logs — not just the rows currently visible in the UI or the current pagination page. Filters applied on the page are respected in the export.
Tracked Events
The Customers Activity page captures events across the major lifecycle moments of your customers' journey. Events are written into the analytics database from two sources:
- JS SDK — fired automatically by the Pelcro JavaScript SDK whenever the underlying action succeeds (subscribe, cancel, log in, etc.), regardless of which UI you use.
- Pelcro User Interface — fired by our Default UI (the customer-facing widget) to capture intent and browsing behavior the SDK itself has no visibility into (viewed a plan, started checkout, abandoned checkout, etc).
If you've built a fully custom UIIf your integration calls the JS SDK directly and does not use the Pelcro User Interface (our Default UI), you will only receive the JS SDK events below. Pelcro User Interface events require using our UI (or explicitly calling
window.Pelcro.insight.track()yourself with a matching event name).
Page & Session
| Event | Description | Source |
|---|---|---|
| Page Viewed | A customer viewed a page. | JS SDK |
Checkout & Funnel
| Event | Description | Source |
|---|---|---|
| Plan Viewed | A customer viewed a subscription plan. | Pelcro User Interface |
| Product Viewed | A customer viewed a product. | Pelcro User Interface |
| Checkout Started | A customer began the checkout process. | Pelcro User Interface |
| Checkout Abandoned | A customer left checkout without completing it. | Pelcro User Interface |
Account & Authentication
| Event | Description | Source |
|---|---|---|
| Registered | A new customer created an account. | JS SDK |
| Logged In | A returning customer signed in. | JS SDK |
| Logged Out | A customer signed out. | JS SDK |
| Converted | A guest or anonymous user became a registered customer. | JS SDK |
| Email Verified | A customer confirmed their email address. | JS SDK |
| Email Verification Resent | A new verification email was sent to the customer. | JS SDK |
| Password Reset Requested | A customer requested a password reset. | JS SDK |
| Password Reset Completed | A customer finished resetting their password. | JS SDK |
| Password Updated | A customer changed their password from their account. | JS SDK |
Newsletter
| Event | Description | Source |
|---|---|---|
| Newsletter Email Submitted | A customer signed up for a newsletter. | JS SDK |
Subscriptions
| Event | Description | Source |
|---|---|---|
| Subscription Created | A customer started a new subscription. | JS SDK |
| Subscription Cancel Started | A customer began cancelling their subscription. | Pelcro User Interface |
| Subscription Cancel Reason Selected | A customer selected a reason while cancelling their subscription. | Pelcro User Interface |
| Subscription Cancelled | A subscription was cancelled. | JS SDK |
| Subscription Renewed | A subscription renewed for another term. | JS SDK |
| Subscription Reactivated | A cancelled subscription was reactivated. | JS SDK |
| Subscription Auto-Renew Disabled | Auto-renewal was turned off for a subscription. | JS SDK |
| Subscription Unsuspended | A suspended subscription was resumed. | Pelcro User Interface |
| Subscription Changed | A customer switched to a different plan. | JS SDK |
| Subscription Members Invited | Members were invited to a subscription. | JS SDK |
| Subscription Member Removed | A member was removed from a subscription. | JS SDK |
| Gift Create Started | A customer began purchasing a gift subscription. | Pelcro User Interface |
| Gift Subscription Purchased | A customer bought a subscription as a gift. | JS SDK |
| Gift Redeem Started | A customer began redeeming a gift subscription. | Pelcro User Interface |
| Gift Subscription Redeemed | A recipient redeemed a gift subscription. | JS SDK |
| Gift Subscription Renewed | A gift subscription renewed for another term. | JS SDK |
Payments & Billing
| Event | Description | Source |
|---|---|---|
| Invoice Paid | A customer's invoice was paid. | JS SDK |
| Coupon Applied | A coupon was applied to a purchase or order. | JS SDK |
| Coupon Rejected | A coupon code failed to apply. | Pelcro User Interface |
eCommerce
| Event | Description | Source |
|---|---|---|
| Order Created | A customer placed an eCommerce order. | JS SDK |
| Cart Item Added | A customer added an item to their cart. | Pelcro User Interface |
| Cart Item Removed | A customer removed an item from their cart. | Pelcro User Interface |
| Cart Viewed | A customer viewed their cart. | Pelcro User Interface |
Customer Address
| Event | Description | Source |
|---|---|---|
| Customer Address Created | A customer added an address. | JS SDK |
| Customer Address Updated | A customer updated an address. | JS SDK |
Payment Methods
| Event | Description | Source |
|---|---|---|
| Payment Method Added | A customer added a payment method. | JS SDK |
| Payment Method Updated | A customer updated a payment method. | JS SDK |
| Payment Method Removed | A customer removed a payment method. | JS SDK |
Profile
| Event | Description | Source |
|---|---|---|
| Profile Updated | A customer updated their profile details. | JS SDK |
| Profile Picture Change Submitted | A customer submitted a new profile picture. | Pelcro User Interface |
| Profile Picture Uploaded | A customer uploaded a profile picture. | JS SDK |
Engagement
| Event | Description | Source |
|---|---|---|
| Saved Item | A customer saved or followed an item (e.g., an article or author). | Pelcro User Interface |
| Unsaved Item | A customer removed a saved or followed item. | Pelcro User Interface |
Paywall
| Event | Description | Source |
|---|---|---|
| Paywall Displayed | A paywall was shown to a customer. | JS SDK |
| Paywall Not Displayed | A paywall was evaluated but not shown to a customer. | JS SDK |
| Inline Paywall Displayed | An inline paywall was shown to a customer. | Pelcro User Interface |
| Inline Paywall Not Displayed | An inline paywall was evaluated but not shown to a customer. | Pelcro User Interface |
Adblock
| Event | Description | Source |
|---|---|---|
| Adblock Detected | An ad blocker was detected in a customer's browser. | JS SDK |
Failed Actions
| Event | Description | Source |
|---|---|---|
| Subscription Creation Failed | A subscription could not be created. | JS SDK |
| Subscription Cancellation Failed | A subscription could not be cancelled. | JS SDK |
| Subscription Reactivation Failed | A subscription could not be reactivated. | JS SDK |
| Subscription Update Failed | A subscription update did not go through. | JS SDK |
| Subscription Renewal Failed | A subscription failed to renew. | JS SDK |
| Subscription Change Failed | A plan change did not go through. | JS SDK |
| Subscription Member Invitation Failed | A member invitation could not be sent. | JS SDK |
| Subscription Member Removal Failed | A member could not be removed. | JS SDK |
| Gift Subscription Redemption Failed | A gift subscription could not be redeemed. | JS SDK |
| Gift Subscription Renewal Failed | A gift subscription failed to renew. | JS SDK |
| Invoice Payment Failed | A customer's invoice payment did not go through. | JS SDK |
Rules and Limitations
Event Visibility Timing
- Events typically appear in the activity list within 1 to 3 minutes after they are sent
- During busy periods, events may appear sooner because batches fill faster
- During quiet periods, it can take up to about 2 minutes before the next batch is processed
- A successful event send means the event was accepted — a short delay before it is visible in reports is normal and does not indicate data loss
Do not expect sub-second visibility. Real-time or sub-second visibility in the dashboard is not guaranteed; timing varies with traffic and system load.
Export Behavior
- Exports are produced in CSV format
- The export respects any filters applied on the page (Date, Event Name, Customer ID, etc.)
Data Retention
Activity events are subject to a retention policy on the analytics database. Older events may be removed from the indexed view after the retention window. Contact support if you have specific retention requirements for your account.
Real-World Examples
Example 1 — Investigating a Customer Support Ticket
A customer reports that their checkout failed. Open Customers Activity, add a Customer ID filter for their ID, and review the recent Page Viewed and Modal Displayed events leading up to the issue. The right-hand panel surfaces the exact URL, path, referrer, and device used — giving support a precise timeline without needing engineering.
Example 2 — Building a Conversion Funnel Report
An analytics team wants to measure how many visitors who view a paywalled article go on to register and then subscribe. Filter Customers Activity by Event Name (Page Viewed → Registered → Subscribed), export each segment to CSV, and join the data externally to build the funnel.
Updated 3 months ago