

Standard Reports
Working with Reports
Pelcro offers a variety of prebuilt reports to give you quick insights into your overall subscription and billing performance. These reports are readily available within the platform and provide data visualizations on various aspects.
Accessing Standard Reports
Log in to your Pelcro account, and click on the "Analytics" tab from your left navigation bar. The Analytics section is divided into two key areas:
- Dashboard: This provides a quick snapshot of your most recent business activities, including customer acquisition, subscriptions, invoices, and payments.
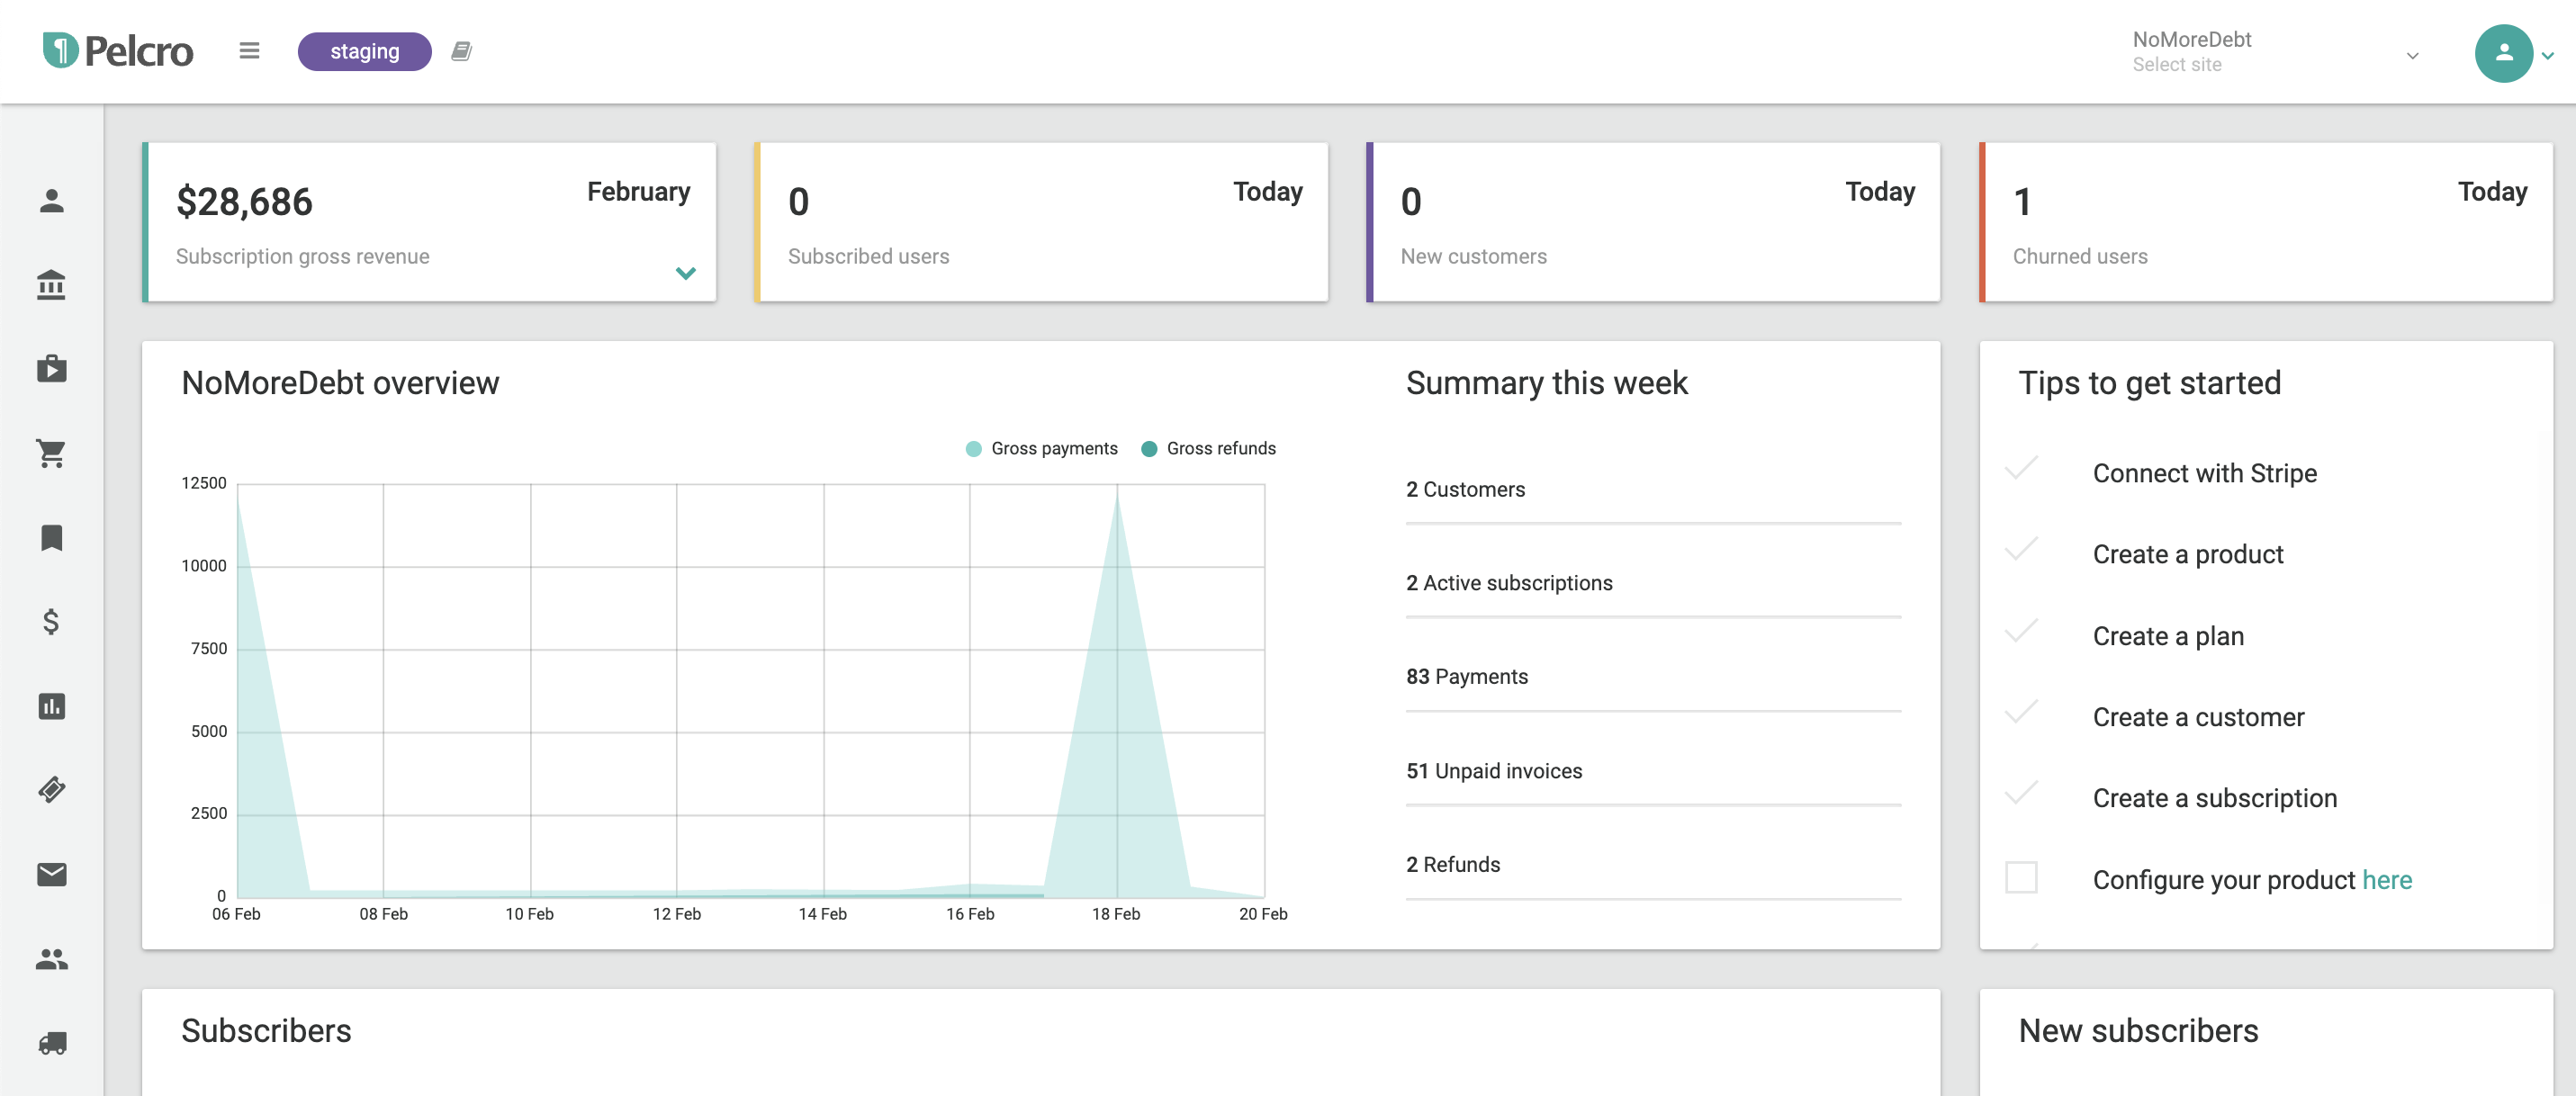
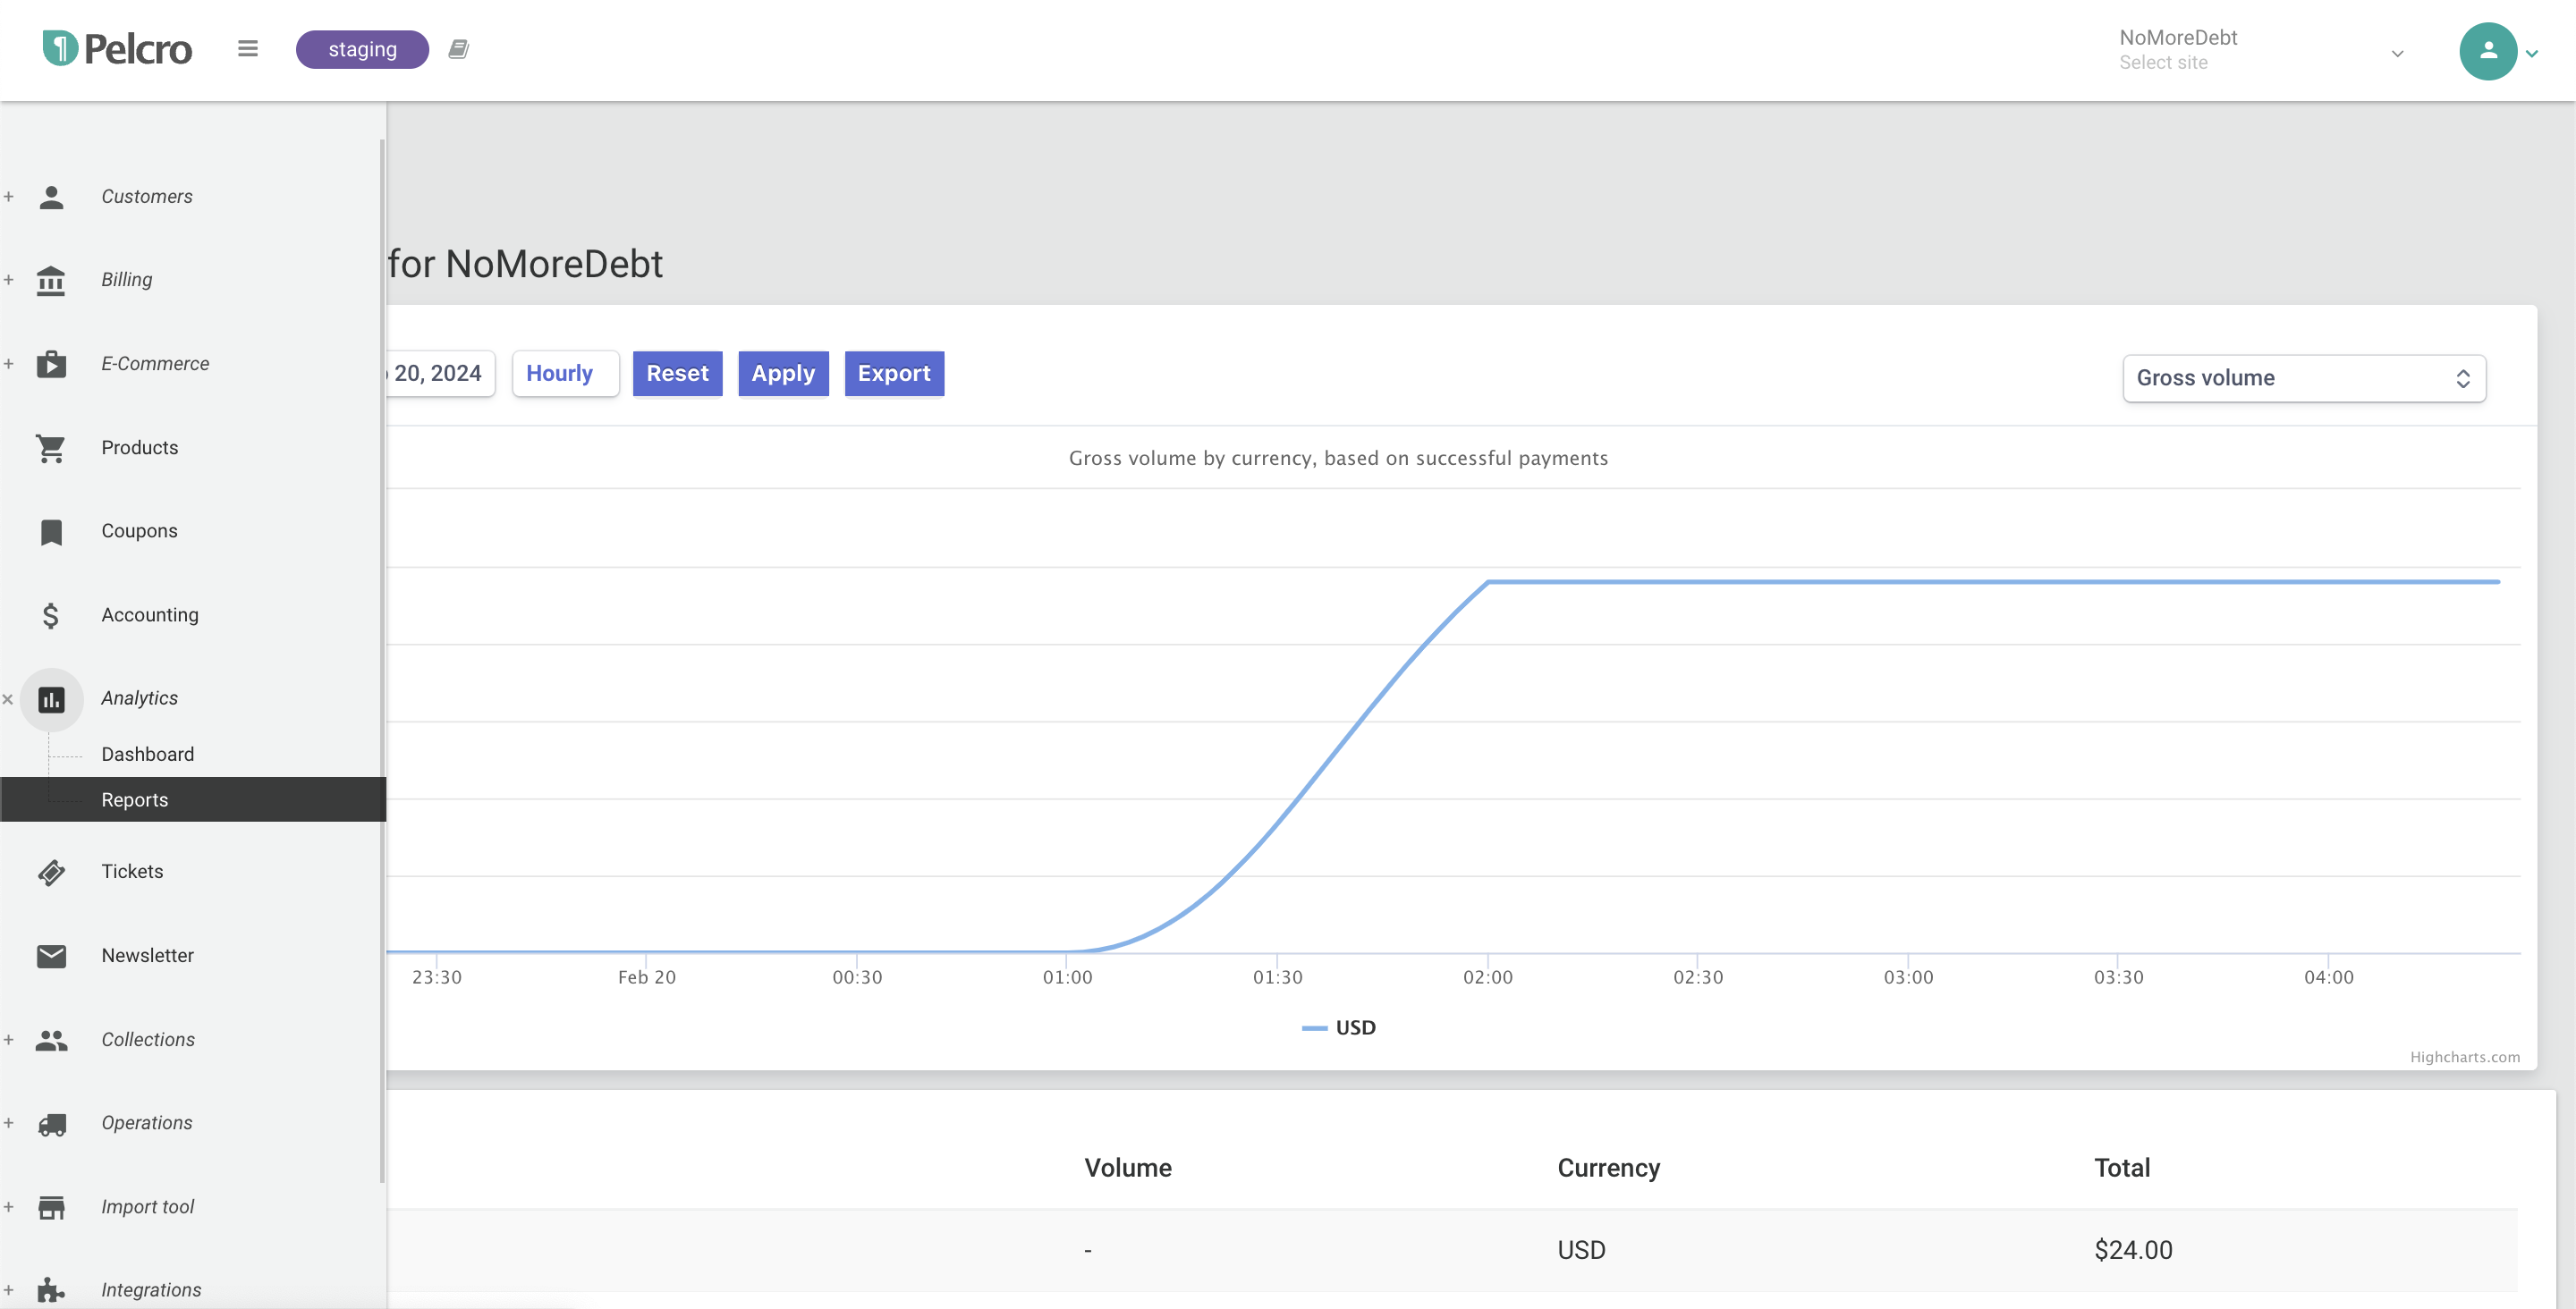
- Reports: This section offers in-depth reports on various aspects of your subscription and invoice transactions. You can analyze trends over specific time frames, export detailed breakdowns, and gain a deeper understanding of your customer behavior.
Navigating Standard Reports
Each of our standard reports has 2 views:
- Graph: This provides a visual representation of trends over time, allowing you to easily identify patterns and fluctuations.
- List View: This offers a detailed breakdown of the data points, enabling you to analyze specific details
You can use the controls available on each report to:
- Select the reporting period and frequency
- Filter by specific criteria that are relevant to selected reports.
- Export data for each report for any operational needs.
List of Standard Reports
| Report Name |
|---|
| Gross Volume |
| Refunds |
| Subscriptions by Sales Rep |
| New Subscriptions |
| Subscriptions by payment type |
| New Phases |
| Active Subscriptions |
| Churned Subscriptions |
| Canceled Subscriptions |
| Expired Subscriptions |
| Charges by Depositor |
| Product/Plan Renewal Rate |
| Shipments Renewal |
| Subscriptions by source |
| Subscriptions by location |
| Subscriptions by coupon |
| Invoices by coupon |
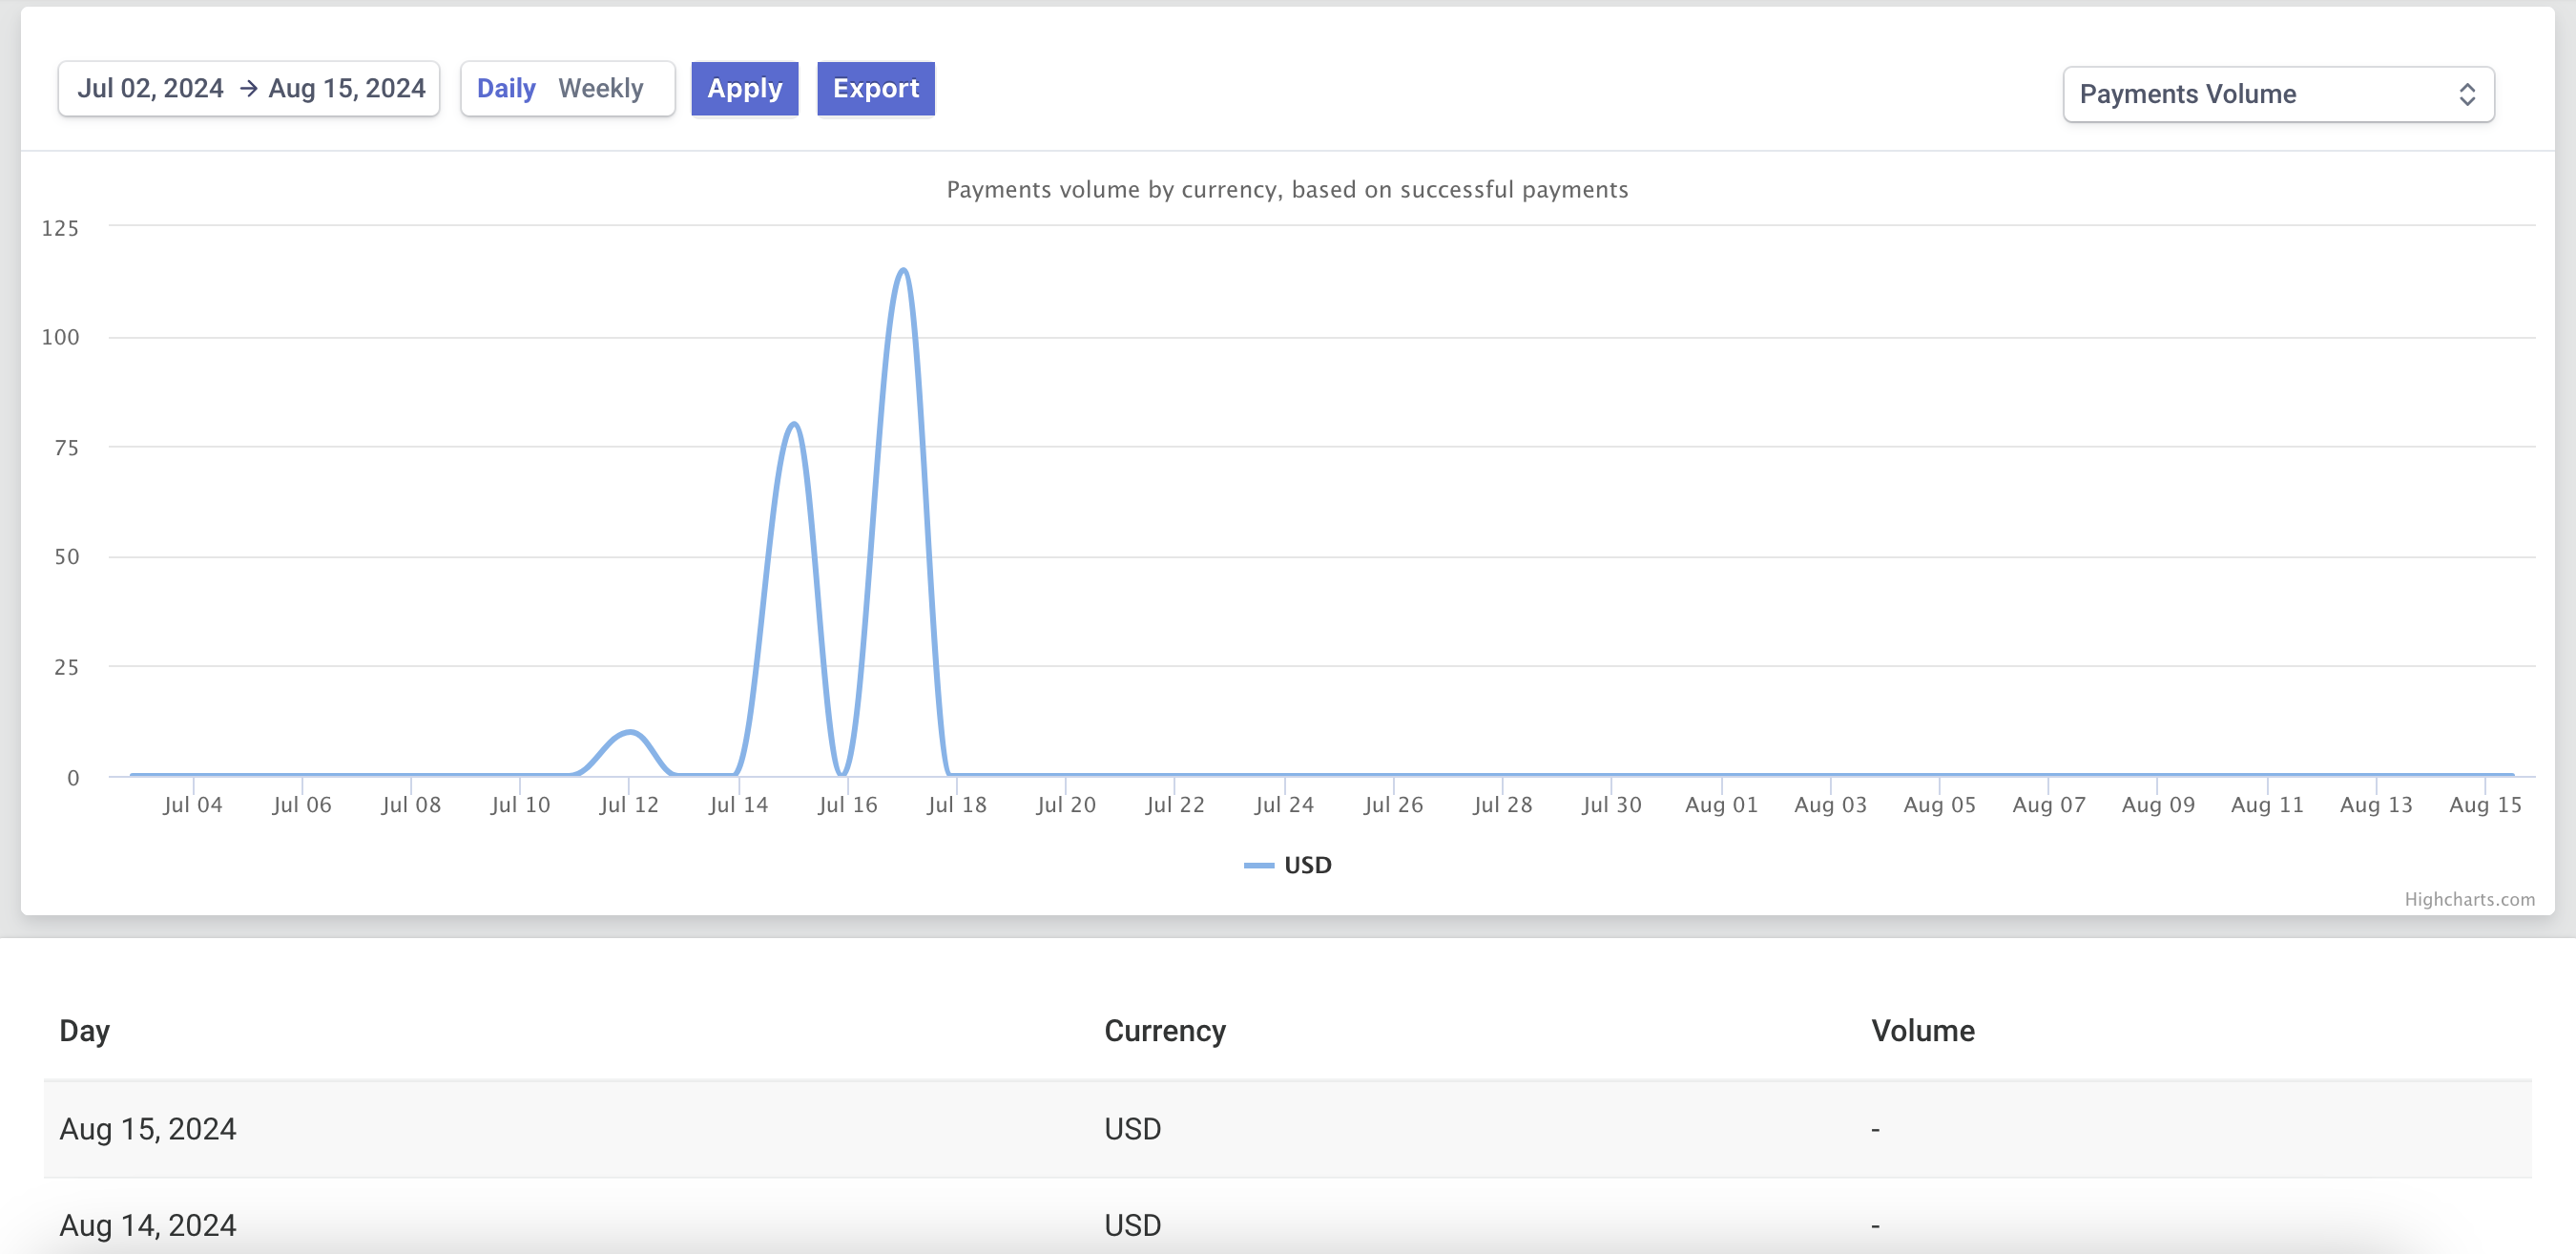
Payments Volume
You can view the number of new successful payments created within a specified timeframe.
| Report Setup | Description |
|---|---|
Available Type(s) |
Line Chart |
X-axis |
Payment Creation Date |
Y-axis |
Sum of Payment Amounts with created_at matching input dates and status = successful |
Series |
Payments currency |
Export Data Points |
Payment Creation Date formatted as MM/DD/YYYY
|
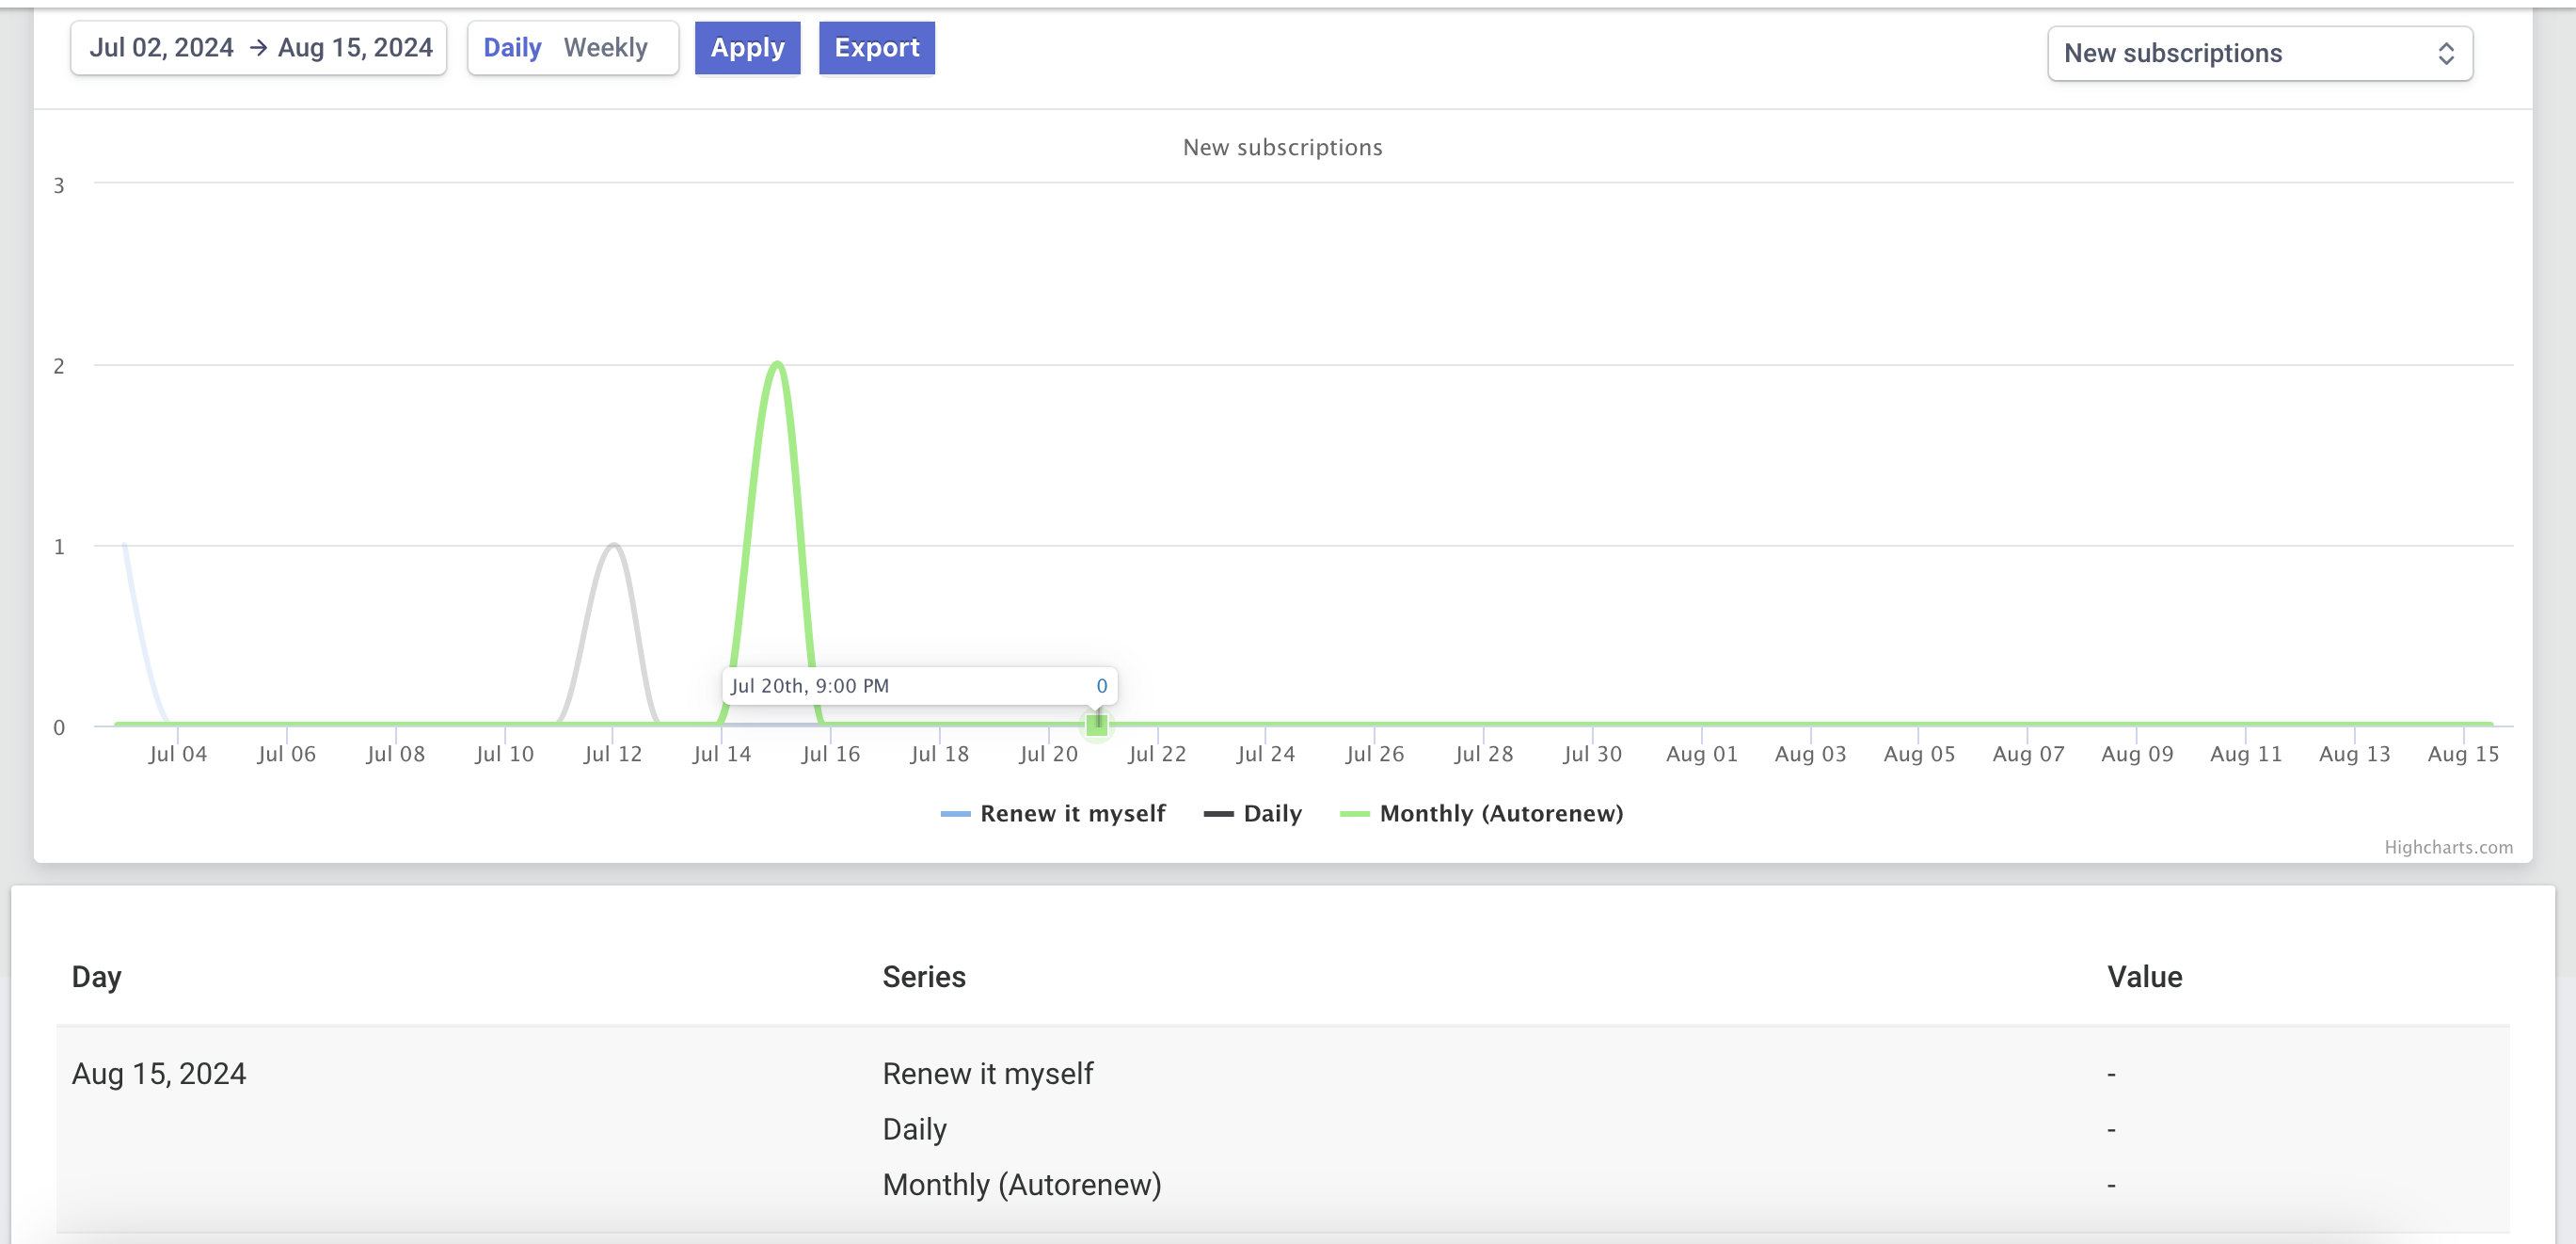
New Subscriptions
The number of new subscriptions created within a specified timeframe
| Report Setup | Description |
|---|---|
Available Type(s) |
Line Chart |
X-axis |
Subscription Creation Date |
Y-axis |
Count of Subscriptions with creation date matching input |
Series |
Subscription plan name |
Export Data Points |
|
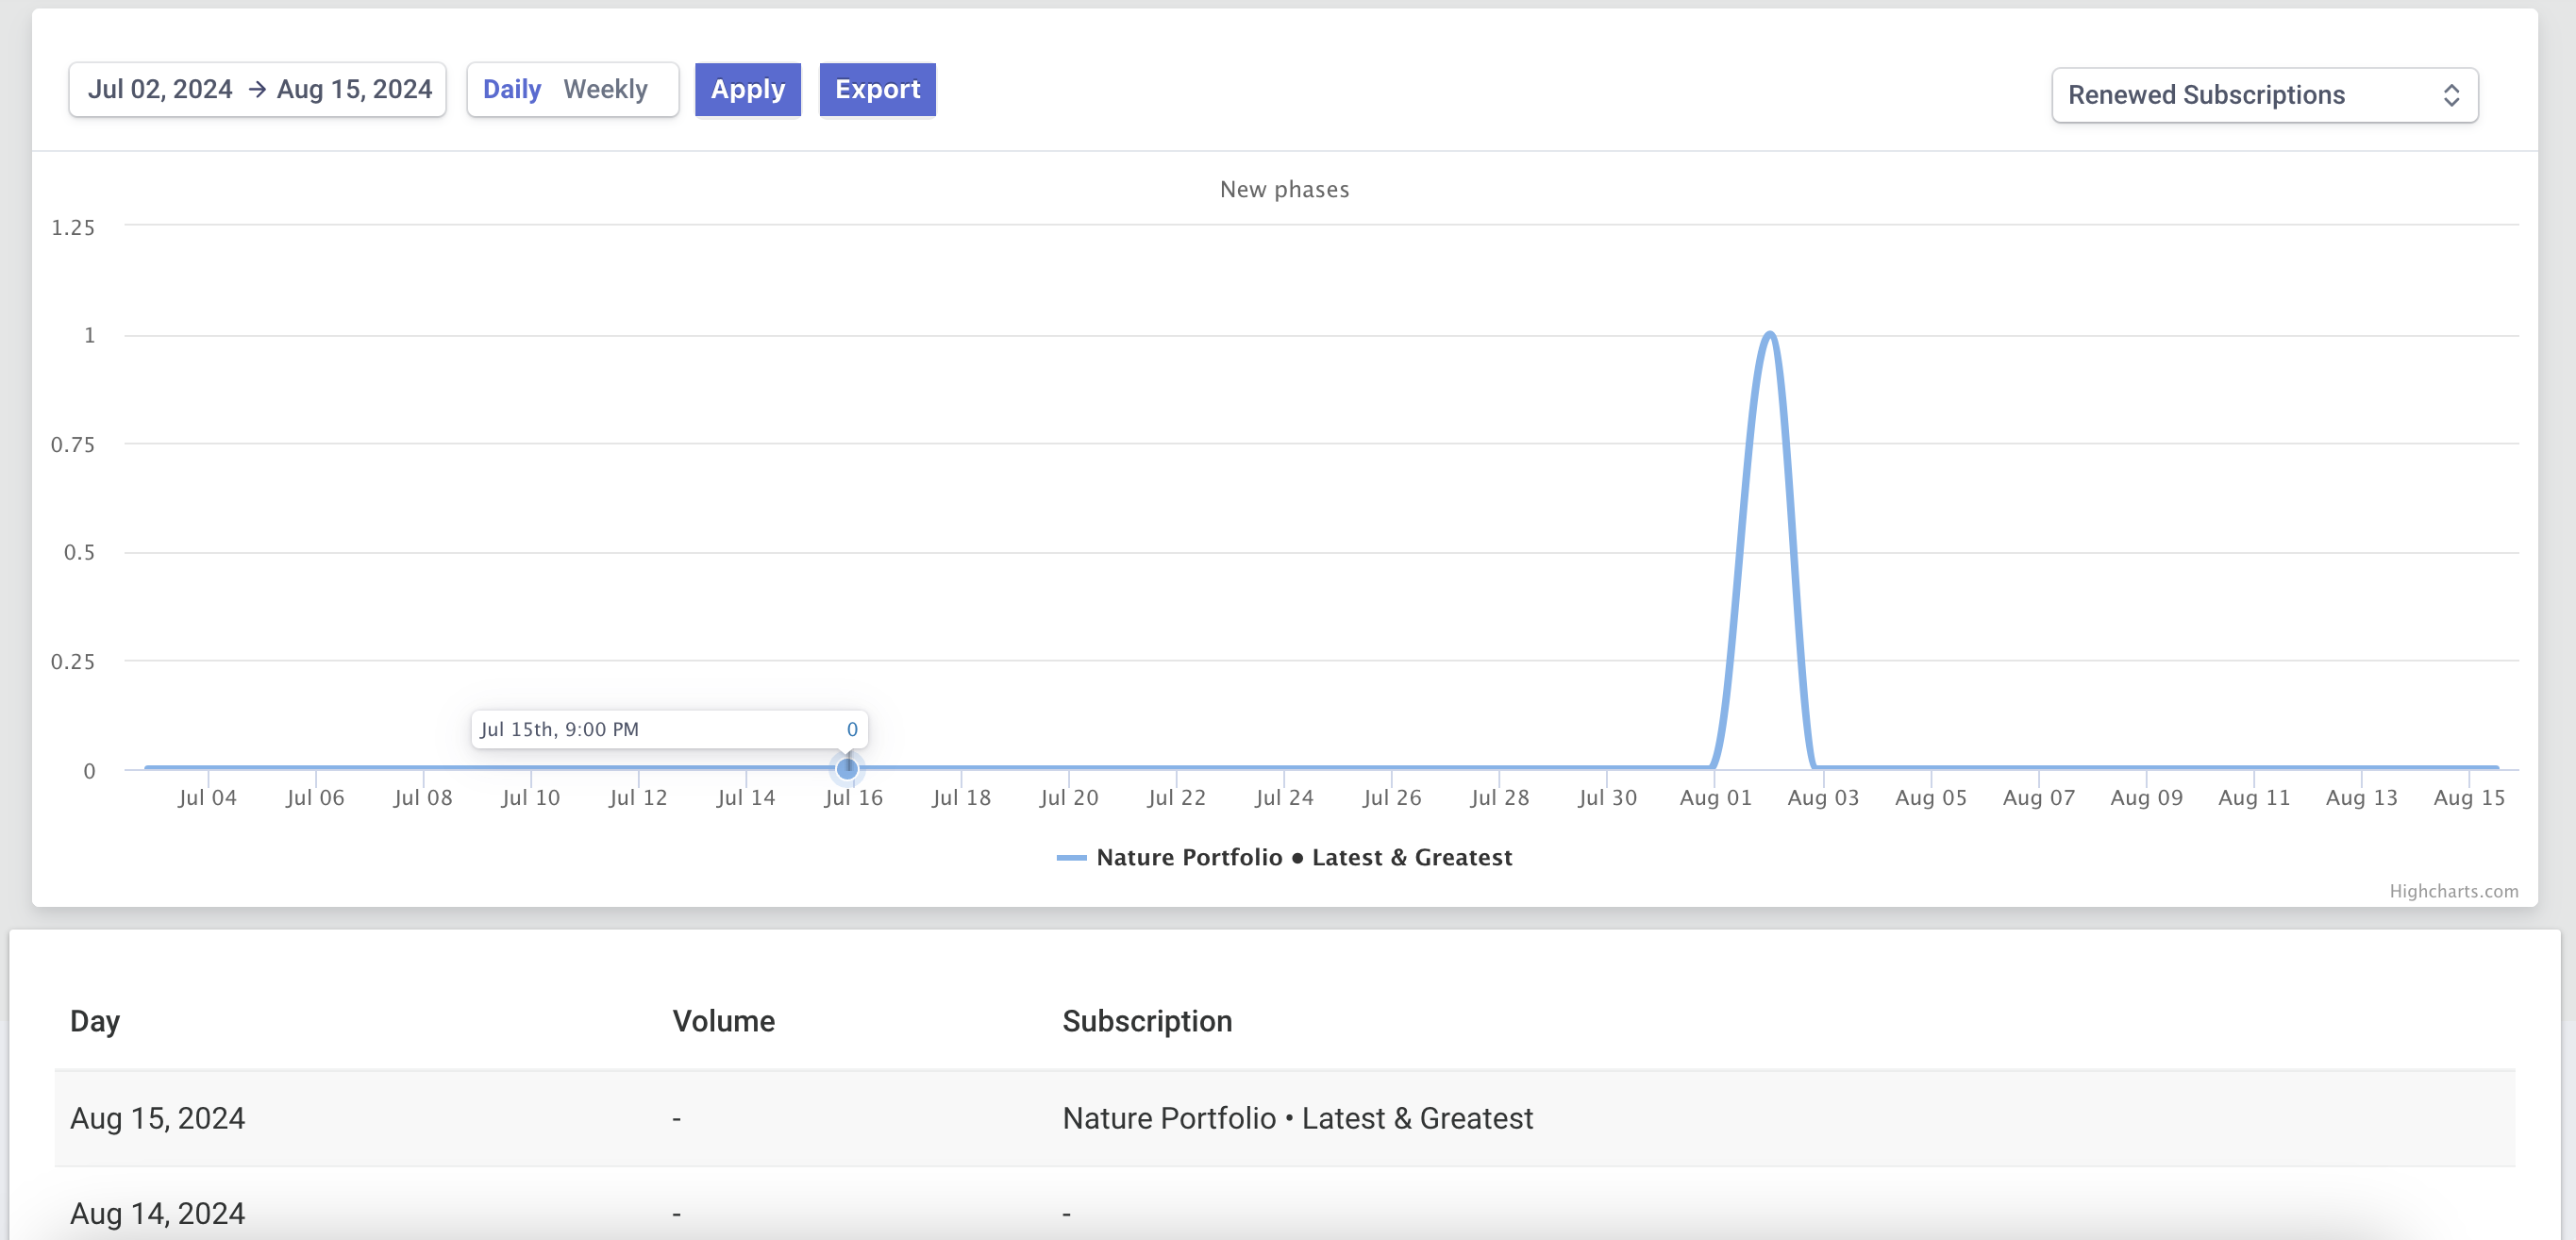
Renewed Subscriptions
The number of subscriptions renewed within a specified timeframe.
| Report Setup | Description |
|---|---|
Available Type(s) |
Line Chart |
X-axis |
Subscription Renewal Date |
Y-axis |
Count of Subscriptions with renewal date matching input |
Series |
Subscription plan name |
Export Data Points |
Subscription Renewal Date
|
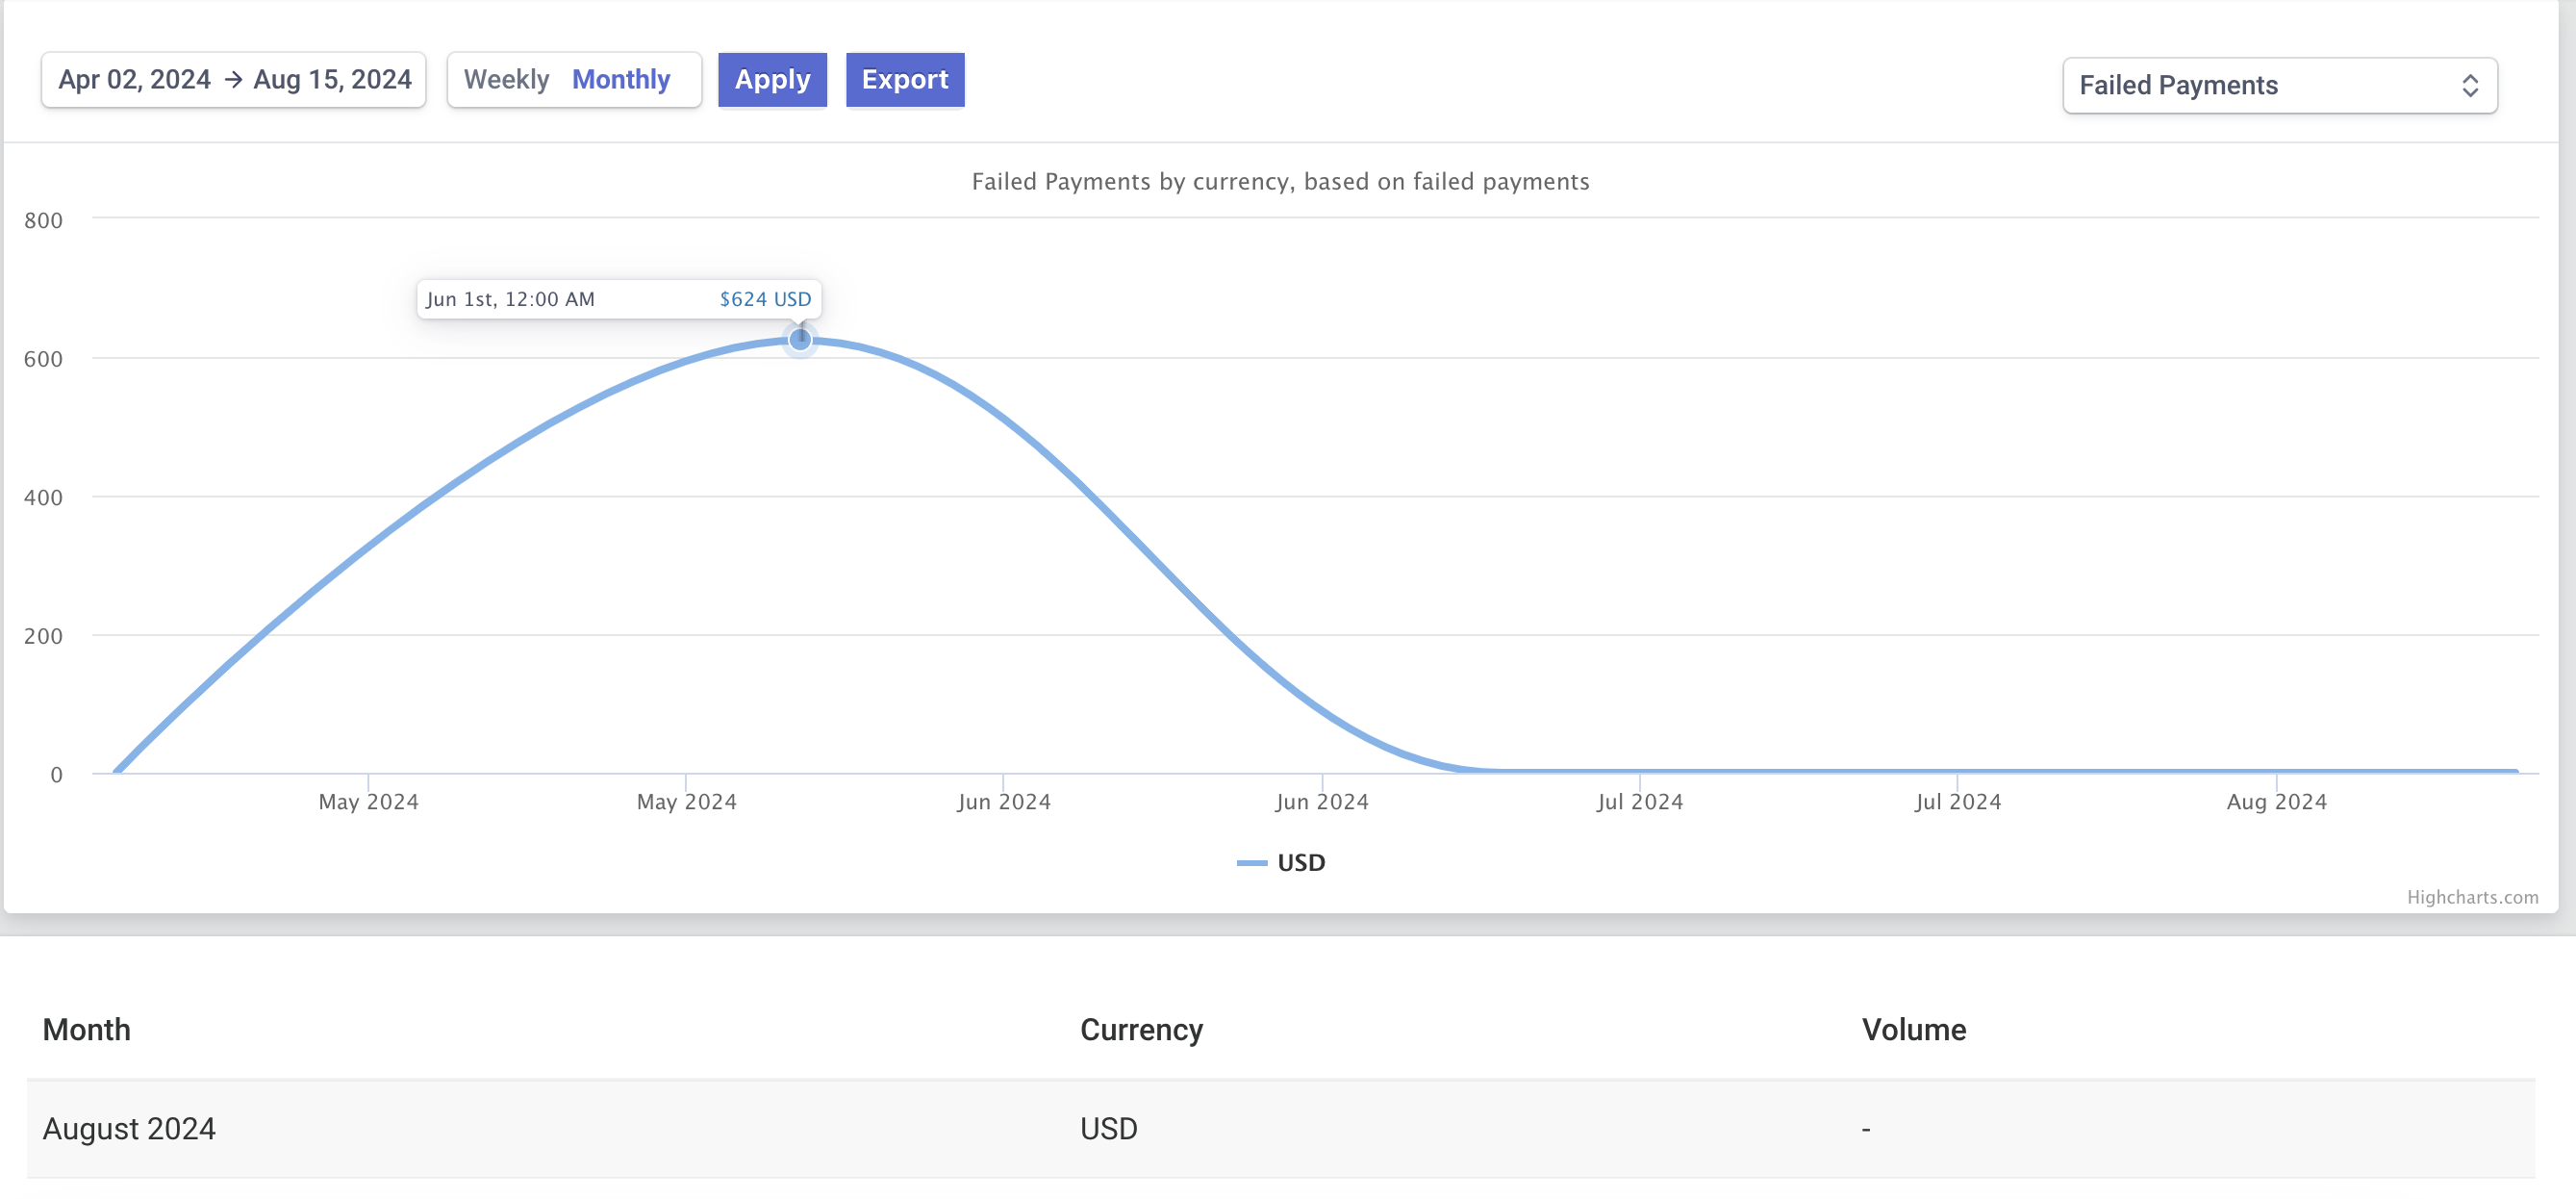
Failed Payments
The number of new failed payments created within a specified timeframe.
| Report Setup | Description |
|---|---|
Available Type(s) |
Line Chart |
X-axis |
Payment Creation Date |
Y-axis |
Sum of Payment Amounts with created_at matching input and status = failed |
Series |
Payments currency |
Export Data Points |
Payment Creation Date: (Date formatted e.g. 11/11/2024)
|
Active Subscriptions
This would show you the total amount of active subscriptions for your business throughout a given period.

| Report Setup | Description |
|---|---|
Available Type(s) |
Chart view |
X-axis |
Specified date & time range |
Series |
Total subscriptions with period start timestamp lying either before or between the specified input dates, and period end timestamp either lying after the specified input dates or unpopulated. |
Export Data Points |
|
Churned Subscriptions
Subscription churn is the number of customers that stop using your product/service within a given time period. This can be due to canceled or expired subscriptions. The churned subscriptions report gives you an overall view of all the subscriptions that have ended or are no longer generating revenue. With this report you can assess your overall churn rate, which plays into calculating the overall success of your business.
.gif")
| Report Setup | Description |
|---|---|
Available Type(s) |
Chart view with product & plan filters |
X-axis |
Specified date & time range |
Series |
Total subscriptions with end timestamp lying between the specified input dates. |
Export Data Points |
|
Canceled Subscriptions
Subset of the churned subscriptions report, this report limits the data to only canceled subscriptions for each product. An overall great way to assess how your product is being received by your customer or if any changes need to be made.

| Report Setup | Description |
|---|---|
Available Type(s) |
Chart & tabular views with product & plan filters |
X-axis |
Specified date & time range |
Series |
Total subscriptions with canceled status and cancelation timestamp lying between the specified input dates. |
Export Data Points |
|
Expired subscriptions
Subset of the churned subscriptions report, this report limits the data to only expired subscriptions for each product. This is great for monitoring how many customers you lose monthly due to subscription expiration and opens the possibility of transitioning more of your products to auto-renew.

| Report Setup | Description |
|---|---|
Available Type(s) |
Chart view |
X-axis |
Specified date & time range |
Series |
Total subscriptions with canceled status and end date timestamp lying between the specified input dates. |
Export Data Points |
|
Subscriptions by Sales Representative
This report allows you to monitor your sales performance by breaking down the subscriptions associated with each representative. For this data to be collected and accurate, with each new subscription, the Sales representative field must be populated.

| Report Setup | Description |
|---|---|
Available Type(s) |
Chart view with product & plan filters |
X-axis |
Sales representatives with associated subscriptions |
Series |
Total subscriptions with creation date timestamp lying between the specified input dates (per sales representative) |
Export Data Points |
|
Subscription by Payment Type
This report helps you track a breakdown of the used payment methods for your subscriptions.

| Report Setup | Description |
|---|---|
Available Type(s) |
Chart view with product & plan filters |
X-axis |
Specified date & time range |
Series |
Total subscriptions with creation date timestamp lying between the specified input dates (per payment method) |
Export Data Points |
|
Subscriptions by Source
This report helps you analyze your subscriptions based on their source which helps you track where the majority of your subscriptions come from. There are multiple subscription sources, e.g subscriptions migrated from another software, imported via the import tool, via phone, the website, Email and others.

Available Type(s) |
Chart & tabular views |
X-axis |
Specified date & time range |
Series |
Total subscription sources with creation date timestamp lying between the specified input dates (per source) |
Export Data Points |
|
Subscriptions by location
The report helps you analyze your subscriptions based on the location they were created, which helps you track whether the subscriptions are increasing or decreasing in certain locations.
Different locations are represented by different colours on the graph.

Available Type(s) |
Chart & tabular views |
X-axis |
Specified date & time range |
Series |
Total subscription locations with creation date timestamp lying between the specified input dates (per location) |
Export Data Points |
|
Subscriptions by Coupon
This report helps you track the subscriptions with coupons. This is useful to help you track your coupon campaign success or explore the effectiveness of your subscriptions when gifted/ discounted.

Available Type(s) |
Chart & tabular views |
X-axis |
Specified date & time range |
Series |
Total subscription with coupons with creation date timestamp lying between the specified input dates |
Export Data Points |
|
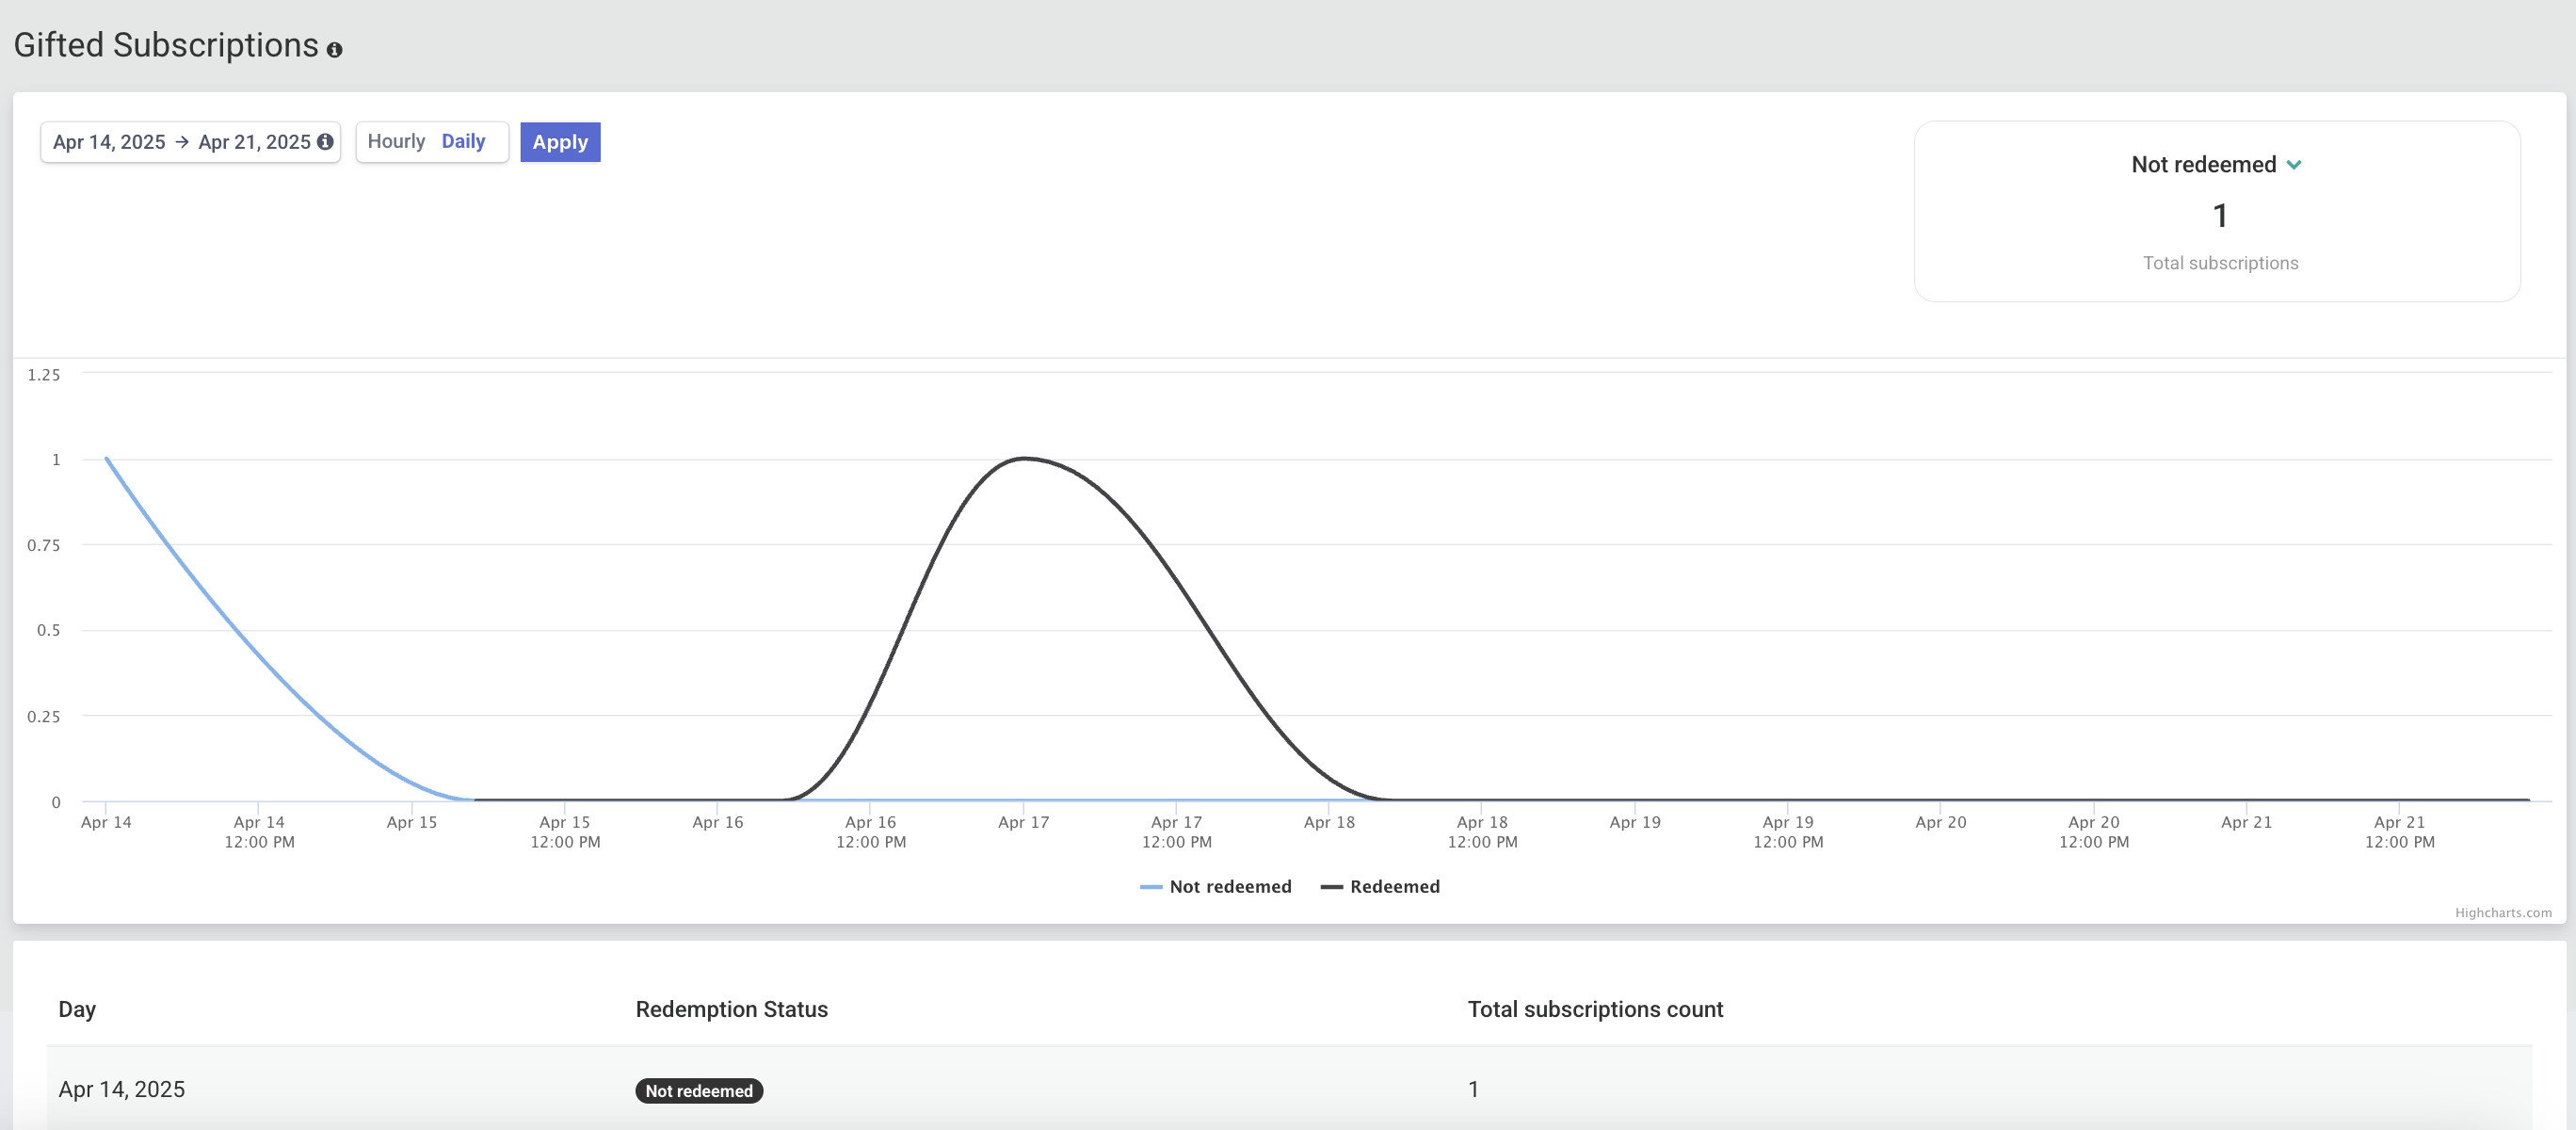
Subscriptions by Gifts
This report helps you track gift subscriptions, whether redeemed or not. It’s useful for monitoring the success of your gifting campaigns, identifying unused gifts, and gaining insights into recipient engagement and overall gift redemption trends.
| Available Type(s) | Chart & tabular views |
| X-axis | Specified date & time range |
| Series | Total gift subscriptions with creation date timestamp lying between the specified input dates |
Updated about 1 year ago