
Analytics
Understanding Your Business with Analytics
Pelcro provides powerful built-in analytics and reports to help you gain valuable insights into your customer base, subscription trends, and overall business health. This guide will equip you with the knowledge to navigate Pelcro's analytics section and leverage data to optimize your business strategies.
Accessing Your Analytics
- Log in to your Pelcro account.
- Click on the "Analytics" tab.
Analytics Layout
The Analytics section is divided into two key areas:
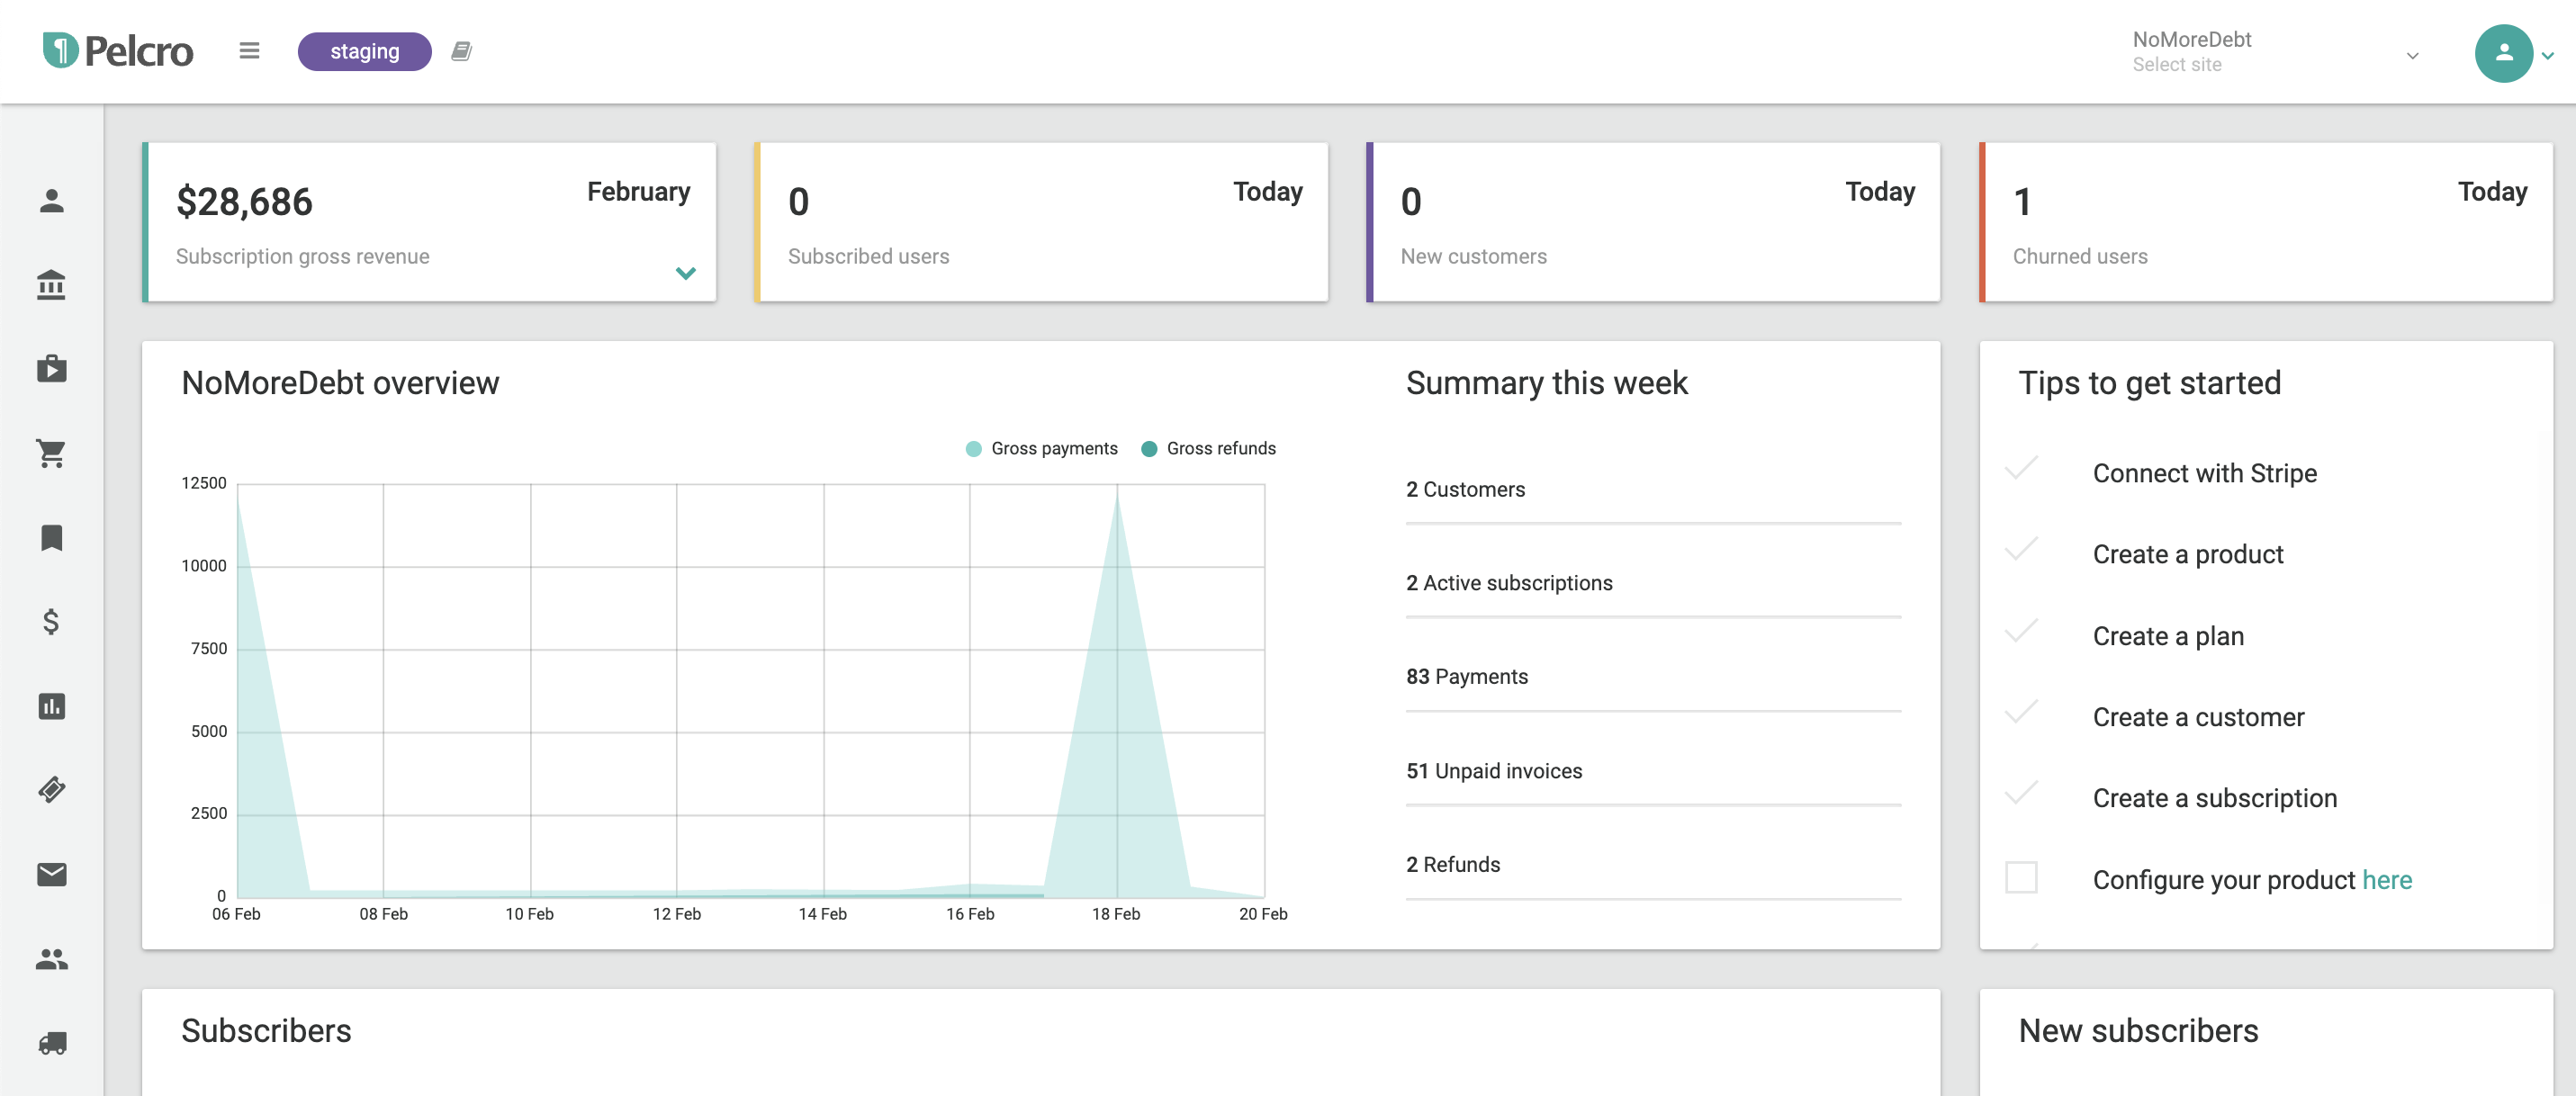
- Dashboard: This provides a quick snapshot of your most recent business activities, including customer acquisition, subscriptions, invoices, and payments.
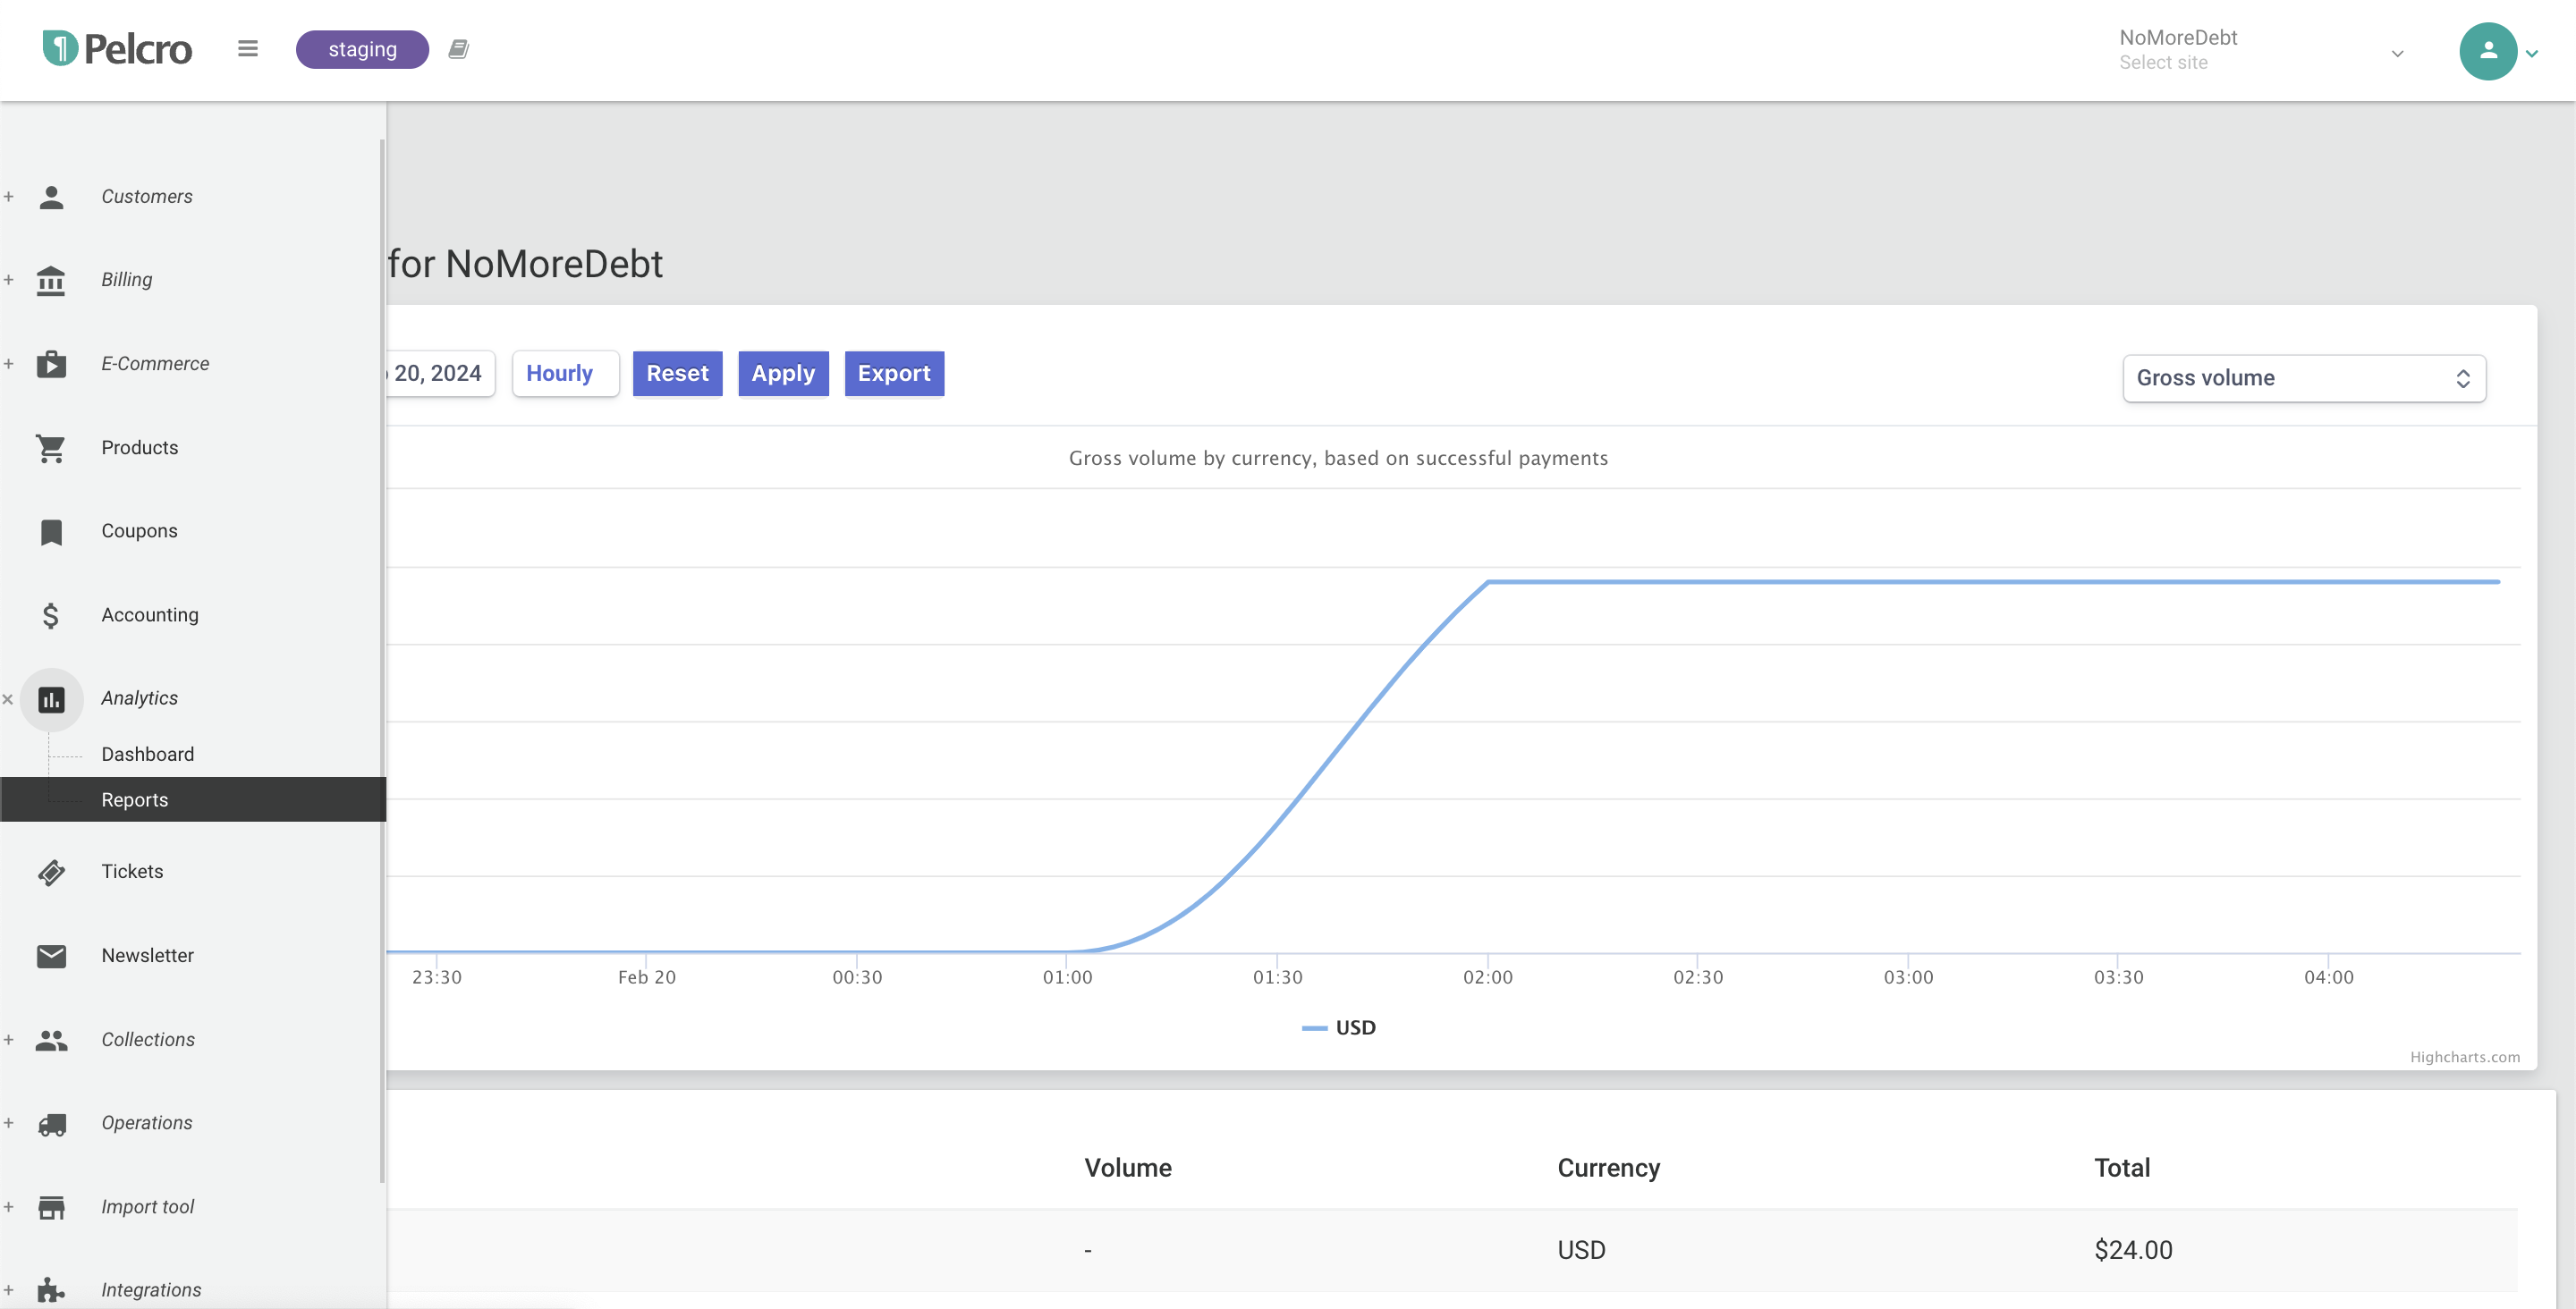
- Reports: This section offers in-depth reports on various aspects of your subscription and invoice transactions. You can analyze trends over specific time frames, export detailed breakdowns, and gain a deeper understanding of your customer behavior.
Available Reports
Pelcro offers a comprehensive range of reports to delve into different facets of your business. Here are some key examples:
- Customer Acquisition: Track reports like "New Customers" and "Subscriptions by Source" to understand how you're attracting new subscribers.
- Subscription Performance: Analyze reports like "Active Subscriptions," "Churned Subscriptions," and "Product/Plan Renewal Rate" to monitor subscription health and identify areas for improvement.
- Financial Performance: Reports like "Gross Volume," "Refunds," and "Charges by Depositor" provide insights into your revenue generation and financial activities.
- Marketing Effectiveness: Analyze reports like "Subscriptions by Coupon" and "Invoices by Coupon" to assess the effectiveness of your promotional campaigns.
Exploring Report Data
When you select a report, you'll be presented with two ways to view the data:
- Graph View: This provides a visual representation of trends over time, allowing you to easily identify patterns and fluctuations.

- List View: This offers a detailed breakdown of the data points, enabling you to analyze specific details.

Customizing Your Analysis
Pelcro empowers you to tailor your analysis to your specific needs. You can:
- Set Date Range: Choose the timeframe you want to analyze (daily, weekly, or monthly).
- Group Data: Group your data by daily, weekly, or monthly intervals for a more granular view.
Daily

Weekly

Monthly

Finally, you also have the ability to export your data into a CSV format. The data exported uses the data range and the report type as a filter.
FAQs
What kind of reports does Pelcro offer?
Pelcro provides a variety of reports covering customer acquisition, subscription health, financial performance, and marketing effectiveness.
How can I view trends over time?
Use the Graph View within each report to visualize trends over your chosen date range.
Can I see detailed data breakdowns?
Yes, the List View provides a comprehensive breakdown of the data points for each report.
Can I customize the way I view my data?
Absolutely! Pelcro allows you to set the date range and group your data by daily, weekly, or monthly intervals.
Updated 6 days ago